
When President Biden signed the sweeping Inflation Reduction Act into law in August 2022, the U.S. solar industry was given the green light for takeoff, and it has shattered records—adding 32.4 GW of new electric generating capacity last year, or 51% since 2022. According to the U.S. Solar Market Insight, Year-in-Review 2023 by the Solar Energy Industries Association (SEIA) and Wood Mackenzie, this is the first time in 80 years that a renewable electricity source has accounted for over 50% of annual capacity additions.
“If we stay the course with our federal clean energy policies, total solar deployment will quadruple over the next ten years,” said SEIA president and CEO Abigail Ross Hopper. “The Inflation Reduction Act is supercharging solar deployment and having a material impact on our economy, helping America’s solar module manufacturing base grow 89% in 2023. We must protect and optimize the policies that are driving these investments and creating jobs, and the stakes in the upcoming election couldn’t be higher.”
According to report estimates, total U.S. solar capacity is expected to grow to 673 GW by 2034, or enough to power more than 100 million homes.
With this growth comes some challenges including high interest rates, tax credit financing, U.S. supply chain, and interconnection. Coupled with uncertainty around the possibility of a new administration in 2025, the report includes high- and low-case forecast scenarios that show how policy and economic factors could impact the solar market over the next ten years, with a 200 GW difference two forecasts.
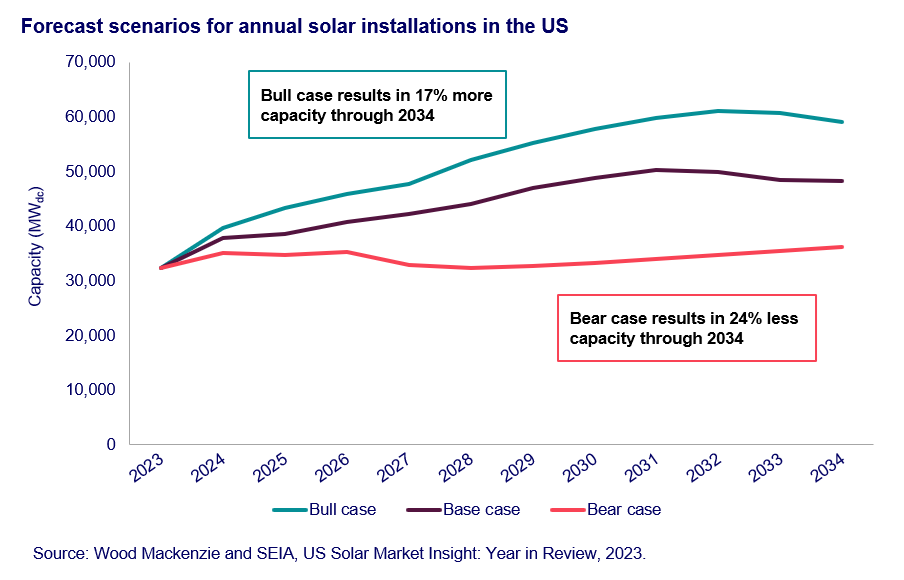
The Bull case is based on the possibility of overcoming many of the existing challenges, for example, interest rates decline and then stabilize, that more corporations become tax equity providers, that there are fewer supply chain restraints and that interconnection issues are resolved. The Bear case flips these assumptions, resulting in what report authors estimate could be a “200 GWdc swing in solar installations over the next decade based on various political and economic outcomes”.
“A high case for U.S. solar with increased supply chain stability, more tax credit financing, and lower interest rates would increase our outlook 17%,” said Michelle Davis, head of global solar at Wood Mackenzie and lead author of the report. “A low case with supply chain constraints, less tax credit financing, and static interest rates would decrease our outlook 24%. Various policy and economic outcomes will have big implications for the U.S. solar industry.”
Supply chain
One of the challenges of rapid growth in the U.S. solar industry is procuring domestic content and reducing reliance on imports from China and other countries. U.S. module manufacturing grew from 8.5 GW to 16.1 GW last year, and established manufacturers have bold plans for future growth. For example, First Solar produced a record 12.1 GW of solar modules, growing 33% over 2022 totals. By the end of 2026, the company expects to have 14 GW of U.S. solar capacity and 11 GW internationally, reaching 25 GW of global solar module production. Additionally, Qcells recently expanded its solar module factory in Dalton, Georgia where it added 2 GW of solar capacity, bringing the factory’s output to more than 5.1 GW. Canadian Solar set up a manufacturing facility in Texas and expect to produce 5 GW of TOPCon modules annually.
However, a few headwinds are facing module manufacturers hoping to set up shop in the U.S., including high interest rates coupled by record low prices for modules from overseas.
Market segments
According to the WoodMac SEIA report, every segment saw year-over-year growth in 2023, bringing total installed solar capacity in the U.S. to 177 GW. The utility-scale sector alone added 22.5 GW of new capacity. Despite challenges in the residential sector including changes in net energy metering (NEM) policy and high interest rates, nearly 800,000 Americans added solar to their homes.
Partly in response to cuts to NEM policies and partly to ensure resiliency, energy storage was added to 13% of residential installations and 5% of non-residential. That figure is expected to jump to 25% of new residential installations this year and will double to 10% of non-residential.
Leading states
Solar has been on an upswing across the nation, with more than half the states with 1 GW of total installed solar capacity. While California stood far ahead of the rest of the country in terms of installed solar capacity, Texas leads for the second time in the past three years with 6.5 GW of new solar installations with 6.5 GW. California’s residential solar market was woefully hurt by NEM changes, and the report authors project a 36% decline across all segments in the state. Colorado, Ohio and Wisconsin are rising stars in U.S. solar, entering the top 10 solar states in 2023.
Looking forward, the Year in Review report expects solar to nearly quadruple from 177 GWdc installed at year-end 2023, to 673 GWdc installed by 2034 and by 2040, it
is expected to make up the largest share of electric generating capacity in the US.
This content is protected by copyright and may not be reused. If you want to cooperate with us and would like to reuse some of our content, please contact: editors@pv-magazine.com.


By submitting this form you agree to pv magazine using your data for the purposes of publishing your comment.
Your personal data will only be disclosed or otherwise transmitted to third parties for the purposes of spam filtering or if this is necessary for technical maintenance of the website. Any other transfer to third parties will not take place unless this is justified on the basis of applicable data protection regulations or if pv magazine is legally obliged to do so.
You may revoke this consent at any time with effect for the future, in which case your personal data will be deleted immediately. Otherwise, your data will be deleted if pv magazine has processed your request or the purpose of data storage is fulfilled.
Further information on data privacy can be found in our Data Protection Policy.