
Research from the National Renewable Energy Laboratory (NREL) looks at the role state program caps are playing in the community solar market. Program caps limit the total capacity of community solar that can be installed in a particular utility service territory or the entire state. In the past, state policymakers used program caps to pilot rapidly growing renewable energy programs. For example, many states started with caps on net metering in the mid-2010s and increased the caps as distributed PV expanded.
According to the US Department of Energy, community solar refers to “any solar project or purchasing program, within a geographic area, in which the benefits of a solar project flow to multiple customers.” The community solar market is rapidly growing, making up 6% of total solar installations, or 5.7 GWac in mid-2022. This is up from 3.4 GWac in 2020 and 0.8 GWac in 2015.
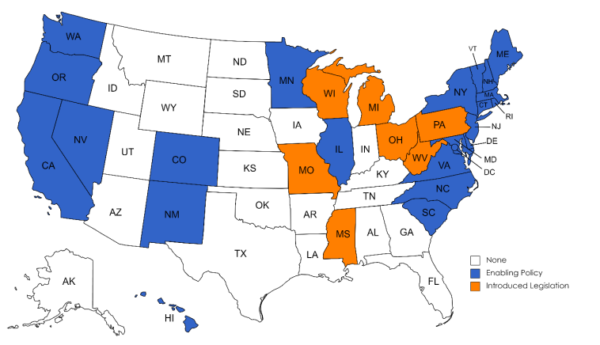
As seen above, 22 states and Washington, D.C., have enacted enabling legislation for community solar as of May 2022 to further this growth. Seven states have also introduced legislation that would enable or incentivize community solar. At the same time, 19 states and Washington, D.C. included caps on their community solar programs as of May 2022.
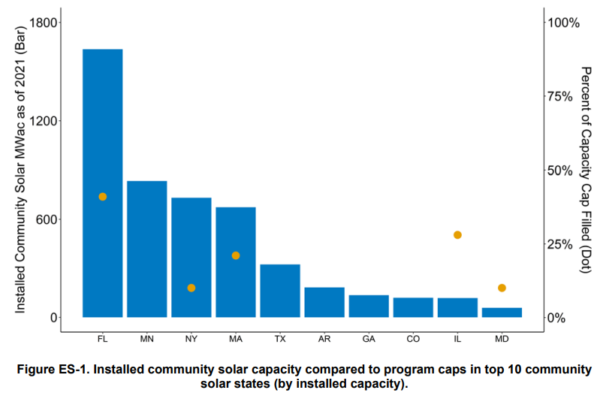
Five of the top 10 states use caps with the installed community solar capacity ranging from 10% to 40% of the program cap. The program caps apply to all solar generation in New York and Massachusetts.
State regulators have used program caps in a variety of different manners and contexts to balance costs and incentivize development while developing best practices in an emerging market. These caps are often heavily negotiated between relevant stakeholders as part of enabling legislation for community solar. Solar developers may prefer more incentives with program caps and a lottery for a few lucrative projects, while others may prefer the certainty and scale that larger, uncapped markets offer.
These community solar caps are applied to suit each state’s individual market and goals. For example, Minnesota chose to have an uncapped community solar market based on the state’s existing NEM policy also being uncapped. While the success of Minnesota’s community solar program is evident, the lessons for other states are less clear. Pressures to add program caps have risen as de facto limits emerged due to long queues, land limitations, lack of subscribers in contiguous counties, the utility’s desire for certainty, and interconnection limits.
The state legislature in Maryland preferred a program cap after seeing the gold rush effect of community solar leading to long application queues in other states. As well, similar pilot program caps had also been used during Maryland’s restructuring of natural gas and electricity markets. The capacity-based program cap has been expanded over time from 196 MW over 3 years in 2017 to 583 MW over 7 years in 2021. As the market matured, Maryland was able to avoid a “boom-bust” cycle of development through program cap revisions and consultation with multiple stakeholders.
New York applied its NEM program cap to cap community solar, along with a funding cap on the incentives available to community solar via the NY-Sun program. A combination of state legislation and broad regulatory discretion from state agencies enabled successful community solar development. For example, the Value or Distributed Energy Resources (VDER) tariffs, also known as the Value Stack, created by the NY State Public Service Commission, compensate when and where distributed sources like solar provide electricity to the grid. This has helped enable more than 1 GW of deployed community solar and provides important lessons for how states enable agency involvement with community solar.
In Illinois, the state took a different approach through a combination of funding and capacity-based program caps. The Illinois Shines, also known as the Adjustable Block Program, created renewable energy certificate incentives with 25% going toward the development of community solar with benefits also being extended to subscribers. This program initially ended up being more than 10 times over-subscribed by developers putting in applications for 1.8 GW of community solar with only around 164.5 MW being accepted.
The Illinois Shines program later expanded with the aim to deploy 400 MW of community solar projects by 2030. The equity-focused Solar for All program provides grants for building solar with a cap based on limited funding which rose from $30 million in 2016 to $50 million in 2021, with $16.5 additional allocations from alternative compliance and ratepayer funds.
Ten states with community solar program caps use them to set minimum carve-outs for low-moderate income (LMI) households. For example, Oregon requires 10% of its total community solar capacity to go toward LMI households. New Jersey requires 51% of its stage 2 pilot program to be set aside for LMI households. Washington D.C. requires all community solar projects to be dedicated to low-income customers. These measures ensure that community solar is able to democratize access and address trends of inequity in solar penetration. The variety of state program cap applications offers important tools and lessons for the future as interest in community solar continues to rise.
This content is protected by copyright and may not be reused. If you want to cooperate with us and would like to reuse some of our content, please contact: editors@pv-magazine.com.


By submitting this form you agree to pv magazine using your data for the purposes of publishing your comment.
Your personal data will only be disclosed or otherwise transmitted to third parties for the purposes of spam filtering or if this is necessary for technical maintenance of the website. Any other transfer to third parties will not take place unless this is justified on the basis of applicable data protection regulations or if pv magazine is legally obliged to do so.
You may revoke this consent at any time with effect for the future, in which case your personal data will be deleted immediately. Otherwise, your data will be deleted if pv magazine has processed your request or the purpose of data storage is fulfilled.
Further information on data privacy can be found in our Data Protection Policy.