The Lawrence Berkeley National Laboratory released the latest edition of its Residential Solar-Adopter Income and Demographic Trends report. The report is based on data from 2.8 million residential households across the country that have installed solar, covering about 86% of all U.S. residential PV systems. This update contains new data on systems installed through 2021, comparisons of income trends for rural vs. urban adopters, and trends among disadvantaged communities, based on the Department of Energy definition.
Solar has been adopted by households across all income levels, as seen on the left of Figure 1 below. Roughly one-third of households adopting solar in 2021 were middle-income, with incomes between $50k and $100k. About 15% had incomes below that, and over half had incomes above that with a significant curve up after $250k.
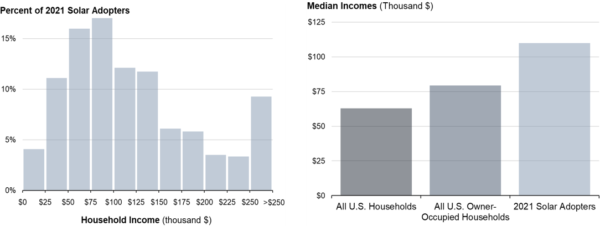
Compared to the broader U.S. population, solar adopter incomes skew high at $110k, as seen on the right of Figure 1. The disparity is driven partly by the data’s overexposure to California, which represents more than half of the total sample, and 42% of systems installed in 2021, a relatively high-income state. However, this skew towards higher incomes remains true in all states, with median relative solar-adopter household incomes ranging from 31% to 68% over the county median.
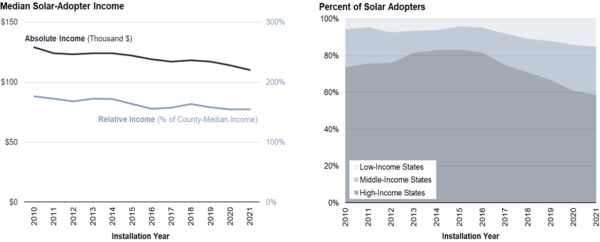
Over time, solar adoption has been slowly shifting towards less affluent households. As Figure 2 on the left shows, the median solar adopter income has fallen from $129k in 2010 to $110k in 2021. Based on the steady downward trend in relative income, which compares solar adopters to all households in the same county, there’s been a “deepening” of solar by reaching lower-income households in existing markets. At the same time, there has been a “broadening” of solar into increasingly less affluent states, as seen in Figure 2 on the right. This broadening trend is driven partly by significant solar market growth in Texas and Florida, which are respectively middle- and low-income states.
As expected, those who adopted solar+storage consistently have higher incomes. In California, solar+storage adopter incomes were 20% higher than standalone solar adopters. The exception to this is Hawaii where about 90% of all residential PV installed in 2021 was paired with storage.
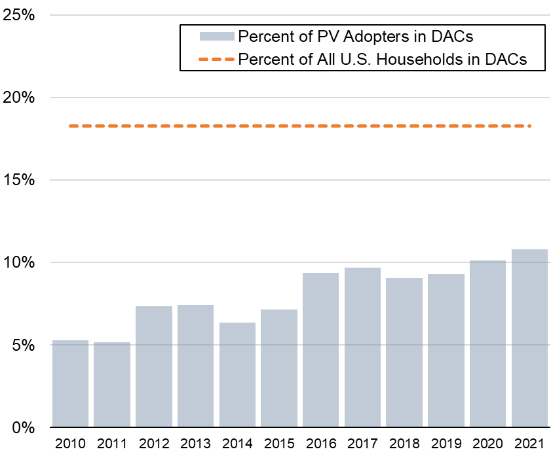
The report found that the solar market in disadvantaged communities (DACs) has more than doubled from 5% in 2010 to 11% in 2021. Despite this, DACs remain underrepresented relative to their 18% share of all U.S households. President Biden’s Justice40 Initiative directs 40 percent of climate, and clean-energy related funding to historically disadvantaged communities through laws like the Inflation Reduction Act, and hundreds of Federal programs. What impacts these programs will have on adoption patterns remains to be seen. These positive trends will be essential for broader adoption as residential solar crosses “The Chasm,” or when a new technology moves from early adopters to being accepted by the general population.
This content is protected by copyright and may not be reused. If you want to cooperate with us and would like to reuse some of our content, please contact: editors@pv-magazine.com.


Just Implement a PMP (Polluters Must Pay) Levy of $0.28/KWhe on the Energy used in the USA (and around the Globe..???) and Credit this DIRECTLY TO SOLAR ENERGY PROVIDERS to provide a “LEVEL PLAYING FUELD” INNTHE ELECTRICITY/ENERGY MARKETPLACE.
[ The above $0.28/KWhe on the 130 Trillion KWhe of Global Energy used today will raise $36.5 Trillion/yr and Offset the Global Societsl Costs of Pollution ..
This Societal Cost is from the 9 Million Premature Deaths (1Million/Victim) Annually and 275Million DALY of Suffering ($100,00/DALY of year long Suffering, Hospitalization, Medical Care, Time-Offfrom Work, Family Expenses and Suffering).
The 1992 UN Rio Agreement, already accepted by 170+ Nations, has agreed to the PMP Principle (#16).. but Officials & Leaders did NOTHING at the behest of the very very deep pocketed POLUTERS… Fossil, Nuclear etc… and thereby stalled the Rapid Deployment of Pollution Free Solar Energy… as Pollution ravaged Human Life, Health & Nature too].
The USA TODAY CONSUMES 14Trillion KWhe/yr of Energy (40,000KWhe/person/yr for 350 Million people). The PMP Levied/Collected on this Energy Used in the USA come to $4 Trillion/yr .. and can FINANCE and Usher in a ZERO POLLUTION USA in a Dozen Years… and PAID FOR BY THE POLLUTERS… ONLY..!!!
WHY IS BIDEN & USA WAITING..???