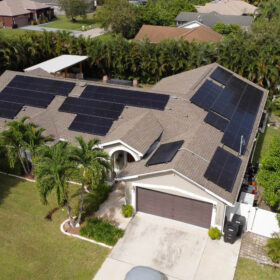
A newly released study by the US Energy Information Administration showed that while 2021 recorded the third highest rate of total annual electric power outages since 2013, state markets with a high rate of rooftop solar adoption have shown to have the shortest timeframe for recovery from outages and higher grid resiliency.
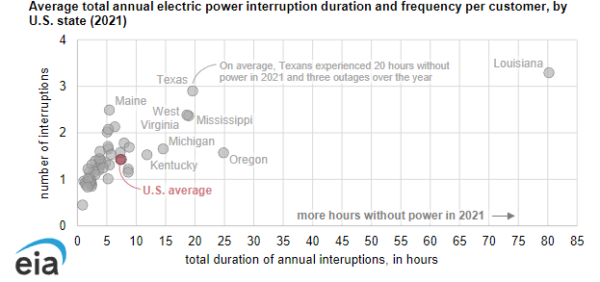
The EIA study found that increasing solar states such as Florida, Delaware, the District of Columbia and Nevada, experienced outages ranging from 52 minutes to 102 minutes in the most recent year. That contrasts to states with prohibitive solar and net metering incentives, such as West Virginia, Louisiana and Mississippi, which saw power outages stretch from 19 hours to more than 3 days.
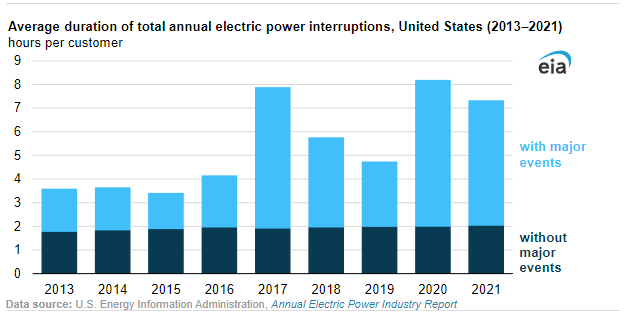
With major outage events, the average utility customer was without power for just under 7.5 hours in 2021, which is an improvement from 2020 at more than 8 hours, a year marked by the Covid-19 pandemic’s disruptions on the electric service market and customer accessibility.
Freak Storm Year
Worth noting is the US experienced a record number or 21 named storms in 2021, the third-most active Atlantic weather season on record. In addition to four major hurricanes in 2021, a winter storm affected the Midwest and Southeast as far south as Texas.
Factors including weather, interference from vegetation near power lines and utility practices caused power interruptions over recent years, while Oregon and Texas, now the 21st and second highest states for solar adoption, experienced significant outages due to both wildfires and extreme winter storms.
Winter Storm Uri from February 2021 saw a multi-day power outage in Texas stretch into weeks as the storm saw the state’s utility system operator, ERCOT, grapple with widespread grid failures across multiple metropolitan regions. While 4.5 million Texans lost power, an additional half a million customers in Louisiana and Oklahoma also grappled with recovery efforts from winter storm Uri in the southeast.
Power Outage Index Calculation
One metric the EIA uses to measure grid reliability is the System Average Interruption Duration Index (SAIDI), which measures the total time on average that a customer experiences non-momentary power interruptions in a one-year period. SAIDI is often paired with the System Average Interruption Frequency Index (SAIFI), which measures the frequency of power interruptions.
For utilities that use the Institute of Electrical and Electronic Engineers (IEEE) standards, the EIA’s outage data is defined as those non-momentary outages lasting more than five minutes.
The SAIDI of an event is calculated by multiplying the minutes of a power outage by the number of customers affected, divided by the total number of customers in the system.
The SAIFI of a weather event is defined as the number of customers affected by an outage by the total number of customers in the local power system, or the percent of customers affected.
This content is protected by copyright and may not be reused. If you want to cooperate with us and would like to reuse some of our content, please contact: editors@pv-magazine.com.


Wire damage from overgrown trees and ice storms (especially in the woods of rural New England) would be the leading cause of outtages, so one would think the higher number of customers per mile of transmission, distribution and service wires would have higher susceptibility to more frequent and longer outtages on a per customer basis.
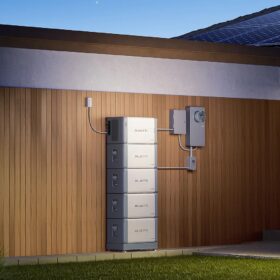
And given that 10% of solar installs might have batteries, what about other more cost effective backup means such as natural gas or propane generators? Don’t ignore them!
My nat-gas 16kW Generac is a $3,000 auto-backup solution that can power my heatpump, lights and other electric appliances that would require $30,000 worth of Power Walls.
Infrequent and short outtages don’t justify “off-grid” Battery $olution$ for me and most others.
Besides, one-third of the time we’re sleeping through outtages unnoticed (aka: at night).
Solar rooftops and especially batteries are being over promoted IMHO.
My full energy credit in kWhrs for NEM, including 18% utility taxes and fees works for my 10kW rooftop with Duke in St Pete, but not for solar customers in many other states…where NEM = Not Enough Money for the kWhrs of excess solar utilities sold to non-solar neighbors at full retail rates with taxes and fees.
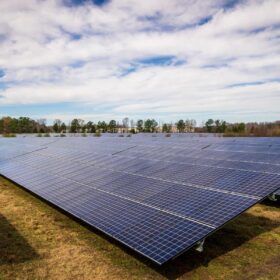
That’s the problem, making NEM = (kWh per “Excess kWh”)…that needs fixing if rooftop is to continue to grow as Utility Scale Solar (the most efficient and cost effective, at 1/3rd or less than the cost per kW capacity vs rooftop) continues to build out and reduce fuel pass-thru costs to ALL residential customers.
Not everyone has means or OWNS a suitable roof for solar…or even OWNS their own roof.
Please keep that in mind while dredging up solar promoting stats.