
As solar comes to more regions of the United States, it is beginning to alter the dynamics of electricity supply and demand. These are most noticeable on weekend days in the spring, when solar output is high but electricity demand is lower than during the week and not inflated by air conditioning use, as it is in the summer.
The result of this is the “duck curve”, as documented in California. There the output of solar is suppressing mid-day demand, with a steep ramp-up in demand that must be met by other resources as the sun goes down. When coupled with a lack of sufficient flexibility in the rest of the electricity fleet and operation of the grid, this can result in negative prices and curtailment of resources.
It turns out that this phenomenon is not limited to California. New England’s grid operator has reported that on April 21 behind-the-meter solar met sufficient demand that for the first time net daytime demand fell to a lower level than overnight demand.
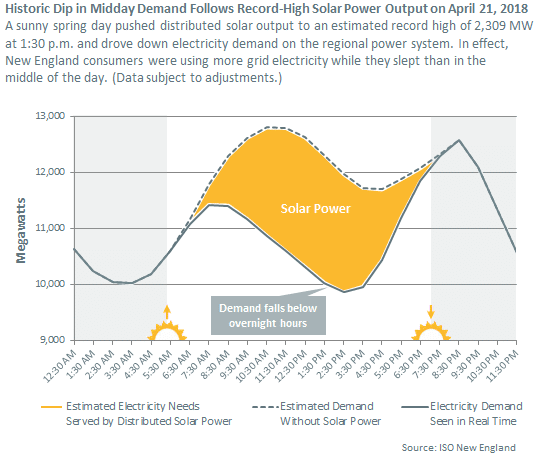
New England ISO estimates that around 1:30 PM distributed solar output in the region reached around 2.3 GW, however the grid operator notes that for legal and technical reasons it has limited visibility into the operation of behind-the-meter resources. This means that solar peaked at around 20% of total demand.
But while the output of these installations is not formally recorded by the ISO, its impact showed clearly in electricity demand. This was particularly true as April 21 was a temperate but sunny weekend day in the Spring.
“We were expecting this to happen at some point as more behind-the-meter solar gets installed in New England and the weather conditions were just right,” states ISO Forecast and Scheduling Supervisor Mike Knowland.
(In)flexibility
Despite New England ISO stating that it was expecting this development, the increase in solar led to a fall in the region’s wholesale electricity price to -$2.65 per megawatt-hour around 3 PM.
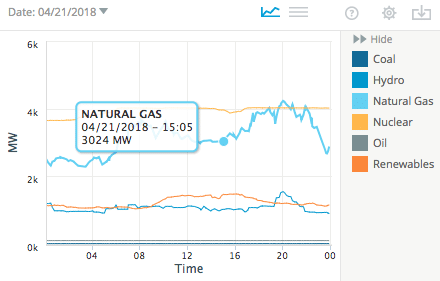 These negative prices do not appear to be a result of technical limitations. New England’s electricity generation is dominated by plants that burn natural gas. Newer gas plants have strong ramping capabilities, and the strong flexibility of entire fleets of gas plants has been demonstrated on a system-wide level in California.
However, New England’s gas plants did not ramp much on the 21st, with generation still around 3 GW during the middle of the day when solar output peaked.
The 20% of total demand that solar generation represented during the afternoon, when combined with another 1.4 GW of renewable energy output still meant that renewables peaked at only around 1/3 of demand. This is far less than the 73% of instantaneous demand that renewable energy has met on California’s grid.
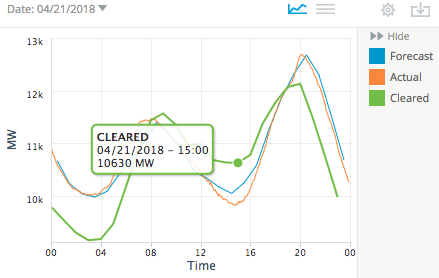
Forecasting and the operation of the market may be issues. The ISO’s forecast of demand was around 200 MW higher than the actual during mid-day, and around 1 GW more resources cleared the day-ahead auction compared to what was actually needed.
 New England ISO notes that it is working with experts to build a day-ahead forecast of distributed solar generation that can be integrated into existing load forecast models. Per reports by the U.S. Department of Energy’s (DOE) National Renewable Energy Laboratories, forecasting and rapid trading of electricity with neighboring grids are both important for integrating higher levels of wind and solar.
Such changes typically do not require significant infrastructure investments. Furthermore, despite the inflexibility of conventional nuclear technology, New England could add a lot more wind and solar before these resources conflict with the output of the region’s three remaining nuclear power plants.
Energy transition, delayed
It is notable that the portion of electricity New England gets annually from wind and solar is much lower than in California – or the nation as a whole. According to the DOE’s Energy Information Administration, wind and solar generation was equivalent to only 5.5% of demand in New England in 2017, as compared to around 8% nationally.
However, due in part to strong NIMBY resistance to wind development, New England has built much less wind. In a reversal of national statistics, EIA’s figures show more solar generation (including behind the meter) than wind, with solar generation equivalent to around 2.8% of demand.
Given a variety of factors including the more northerly latitude, it will be harder for New England to integrate high levels of solar than it is in California. And while mass deployment of energy storage will help New England solar to meet evening demand, existing battery technologies will not address the mismatch between greater productivity of solar in the spring and summer and greater combined demand for heating and power in the winter, which drives high winter electricity prices.
One key resource that could help the region meet winter energy demand, particularly the evening peak, is offshore wind.
Rhode Island put the nation’s first offshore wind farm online in 2016, and Massachusetts has mandated that utilities procure power from 1.6 GW of offshore wind plants by 2027. However, development of this resource has been slow.
This content is protected by copyright and may not be reused. If you want to cooperate with us and would like to reuse some of our content, please contact: editors@pv-magazine.com.


What ISO-NE, the utilities, and the Massachusetts DPU need to realize is that individual consumers of utility power no longer have their utility as their only option. Even their noting “that for legal and technical reasons it has limited visibility into the operation of behind-the-meter resources” is a statement that they do not CARE about behind-the-meter resources, because they haven’t marshalled the financial resources to develop those technical measurements, or to lobby with New England legislatures that they need them. This is an attitude of arrogance and detachment.
In front of ISO-NE, and, no doubt, dozens of similar RTOs (or whatever the proper technical term happens to be), is whether they pursue a modification of the model they have always pursued, and risk splitting their grid into the “above ground”, or on-the-grid component, and “below ground”, or largely autonomous behind-the-meter component, or changing themselves, the utilities they regulate, and urging the legislatures and DPUs they work with that producing consumers need to be NEGOTIATED with, and incentivized to cooperate. (And, by the way, some never will.)
The point is this duck-curve reliability stuff is only ISO-NE’s problem, that of the grid. Units and groups which choose to abandon the grid and this problem will deal with energy imbalances on their own, because they have to. Indeed, that’s their central organizing principle.
ISO-NE and others are failing to understand that this is forcing them to contend with different classes of power needs, as well as consumers who are, in effect, their own utilities. Not all consumers need quality power, and the imposition of costs of maintaining quality power upon all to provide it to some is unfair. That grids have been designed with uniform quality of power for all is not the consumer’s fault.
It’s time for ISO-NE and the utilities to step away from the attitude that they are the center of the Universe and the DPUs are their handservents. We don’t need their power. Not any longer, at least soon.