The U.S. recently exceeded five million solar installations, with the residential sector accounting for 97% of all solar installations in the U.S., according to data from the Solar Energy Industries Association (SEIA) and Wood Mackenzie.
A recent report, The state(s) of distributed solar—2023 update from the Institute of Local Self Reliance (ILSR), estimates that 29 GW of solar capacity was installed in 2023; 31% of which is distributed solar. Distributed solar is solar that is owned by individuals, small businesses and public entities—and is generated at or very near the site where it is used.
The map below shows how much distributed solar was installed in each state through 2023, relative to population.
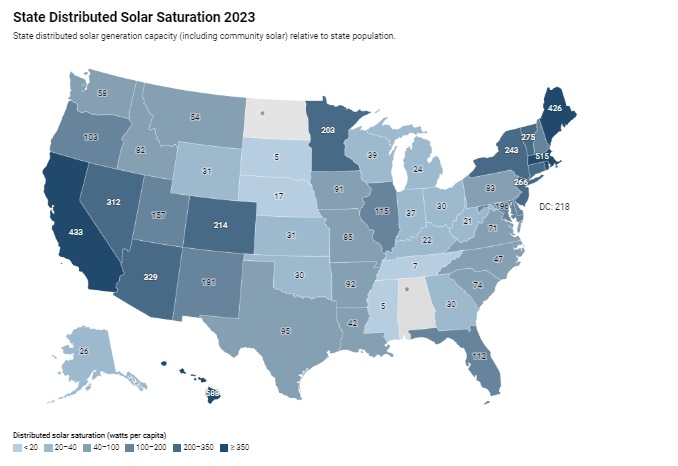
For the purposes of the map, community solar in Colorado, Hawaii, Illinois, Maryland, Massachusetts, Minnesota, New Jersey, New York, and Oregon is included as distributed solar.
To arrive at these figures, ILSR added its own figures on state community solar capacity to the U.S. Energy Information Administration’s (EIA) figures on small-scale photovoltaic capacity by state. This sum was divided by state population estimates from the U.S. Census Bureau, resulting in a figure of watts per person. The U.S. EIA did not collect data from Alabama or North Dakota.
A key finding is that 21 states and the District of Columbia have a distributed solar saturation of more than 100 watts per capita.
California, Arizona, Nevada, and Massachusetts all land in the top ten for both distributed solar saturation and total solar generation capacity.
California, Texas, Florida, and North Carolina have the largest overall capacity whereas Hawaii, Massachusetts, Rhode Island and California have the greatest distributed solar saturation, as measured in installed distributed solar capacity per capita.
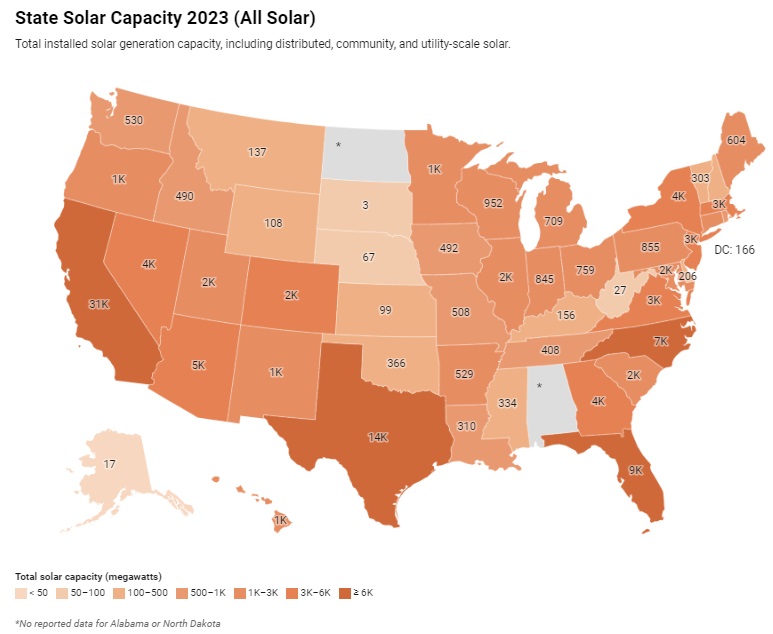
Several state solar markets have made significant changes since ISLR’s 2022 update. Installed distributed capacity grew by more than 1 GW in Texas (6 GW), California (4.7 GW), Florida (2.5 GW), Ohio (1.8 GW), Virginia (1.2 GW), and Colorado (1.1 GW).
Five states doubled or more than doubled installed capacity in 2023, including South Dakota, Ohio, Pennsylvania, West Virginia, and Arkansas. While doubling capacity is good news, it still may not amount to much as both South Dakota and West Virginia are considered “solar laggards” according to PV Intel’s analysis, based on EIA data.
Other states that saw strong growth include Wisconsin, Indiana, Montana, Louisiana, Maine, and Michigan.
Community solar
Community solar provides a way for people to benefit from solar energy who may be unable to install solar either due to financial restrictions or because they do not have a suitable rooftop for solar.
ILSR’s 2024 Community Power Scorecard states that “a model community solar policy has no cap, has a fair compensation rate, simplifies the billing process for subscribers, meaningfully accounts for the challenge of reaching low- and moderate-income (LMI) subscribers, and rewards other beneficial development or small subscriber-friendly practices”.
ILSR reports that state policies like community solar, net metering, simplified interconnection rules and a renewable portfolio standard carve-out for distributed energy are crucial in promoting the adoption of distributed solar.
The distributed solar report notes that 19 states and the District of Columbia currently have community solar policies and highlights nine states that ILSR calls “solar-enabling” for their strong community solar policies and installed capacity.
Total installed community solar capacity at the end of 2023:
- New York 1.72 GW
- Minnesota 904 MW
- Massachusetts 852 MW
- Illinois 251 MW
- Maryland 149 MW
- Colorado 147 MW
- New Jersey 137 MW
- Oregon 29 MW
- Hawaii 4 MW
ILSR tracks these policies and others in its Community Power Map. According to the ILSR’s Community Power Scorecard, 26 received failing grades in 2024, suggesting that many states have much room for improvement.
ILSR’s State(s) of Distributed Solar analysis is updated annually. For a historical snapshot, explore archived analyses of distributed solar by state in 2022, 2021, 2020, 2019, 2018, 2017, and 2016.
This content is protected by copyright and may not be reused. If you want to cooperate with us and would like to reuse some of our content, please contact: editors@pv-magazine.com.


By submitting this form you agree to pv magazine using your data for the purposes of publishing your comment.
Your personal data will only be disclosed or otherwise transmitted to third parties for the purposes of spam filtering or if this is necessary for technical maintenance of the website. Any other transfer to third parties will not take place unless this is justified on the basis of applicable data protection regulations or if pv magazine is legally obliged to do so.
You may revoke this consent at any time with effect for the future, in which case your personal data will be deleted immediately. Otherwise, your data will be deleted if pv magazine has processed your request or the purpose of data storage is fulfilled.
Further information on data privacy can be found in our Data Protection Policy.