
Roughly half of all growth in U.S. renewable energy generation and capacity since 2000 is associated with state renewable portfolio standard (RPS) requirements, although that percentage has declined in recent years, representing 30% of all U.S. renewables capacity additions in 2022. However, within some regions, particularly the Northeast and Mid-Atlantic, RPS policies continue to play a central role in motivating renewables growth.
The report, U.S. State Renewables Portfolio & Clean Electricity Standards: 2023 Status Update, from Berkeley Lab found that statewide policies require roughly 300 TWh of additional clean electricity supply by 2030 and 800 TWh by 2050, requiring total non-hydro renewables generation to reach 28% of electricity sales by 2050 (compared to 17% today). This amounts to roughly 25% of the Energy Information Administration’s (EIA) projected growth target through 2050.
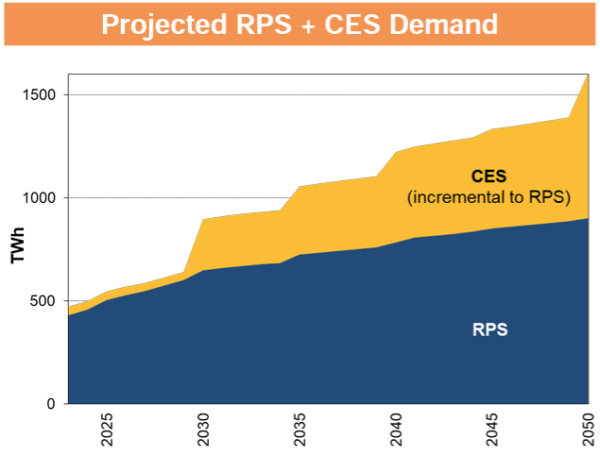
RPS demand growth tapers off after 2030, as most states pass their maximum percent target, an important note to consider as state clean electricity standards (CES) can pick up the pace of renewable energy deployments at that point, Berkeley Lab notes. The report defines CES as being similar to an RPS, but the target is based on a broader set of eligible technologies.
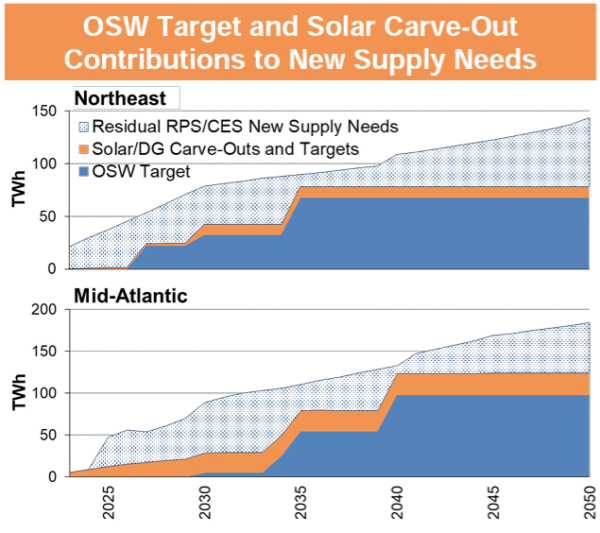
Roughly half of the 2050 CES demand (see chart above) can be met with existing resources, primarily nuclear and large hydro. A sizeable share of new supply needs may be met over the same timeframe by offshore wind and solar plus distributed generation targets (see chart below).
RPS standard
An RPS is defined as a long-term statewide goal for the state to generate a specified percentage of its electricity the state’s utilities sell from renewable energy resources.
Among the 29 U.S. states plus D.C. with an RPS, 16 states have RPS targets of at least 50% of retail sales, and 17 states have a 100% CES or RPS target. Hawaii and Rhode Island have 100% RPS standards, while Maine, Vermont, New Mexico and Virginia have 75% or more RPS targets.
CES standard
The Berkeley Lab report notes several states along the West Coast, Mid-Atlantic and Northeast have an RPS standard that overlaps with CES guidance.
Out of 150 total statewide bills introduced over the last year, 63 bills have strengthened RPS and CES standards versus 32 bills that have weakened statewide standards, while 55 additional bills had no impact.
Two small states who claim the highest rate of electricity, Hawaii (44 cents/kWh) and Connecticut (33 cents/kWh), revised RPS standards or created a new CES target. Hawaii revised its RPS to be based on a percentage of total generation, rather than a percentage of retail sales, a trend which the report suggests raises Hawaii’s target of producing more clean energy.
Connecticut created a new CES targeting 100% zero-carbon electricity by 2040. Other states such as Minnesota (100% CES by 2040, increased RPS to 55% by 2035) and Rhode Island (100% RPS by 2033) bolstered their clean energy plans as well.
Growth drivers
Statewide RPS and CES policies contributed to 44% of total renewables growth in the 22-year timeframe the two standards have been in play. Those policies required a 281 TWh increase and contributed to non-hydro power-related renewables growth of 630 TWh since the year 2000.
The Berkeley Lab report asserts that RPS and CES standards are just one pillar supporting statewide renewable energy increases, while the other pillars include voluntary utility procurement (i.e., integrated resource plans), net metered solar, often not counted toward RPS standards, and voluntary green power markets (ie: corporate power purchase agreements, green power programs).
In Western states, net metered solar caused states like California to exceed RPS requirements on paper, even though about 33 TWh of net metered solar generation across those states is not technically used in RPS tabulation, a reason for strong utility IRP’s and corporate environments, the report says.
Pricing trends
Prices for New England Power Pool Class I RECs remained at roughly $40/MWh over the past year, just below alternative compliance payment rates in the larger state markets, while REC prices in the PJM Interconnection market continued to rise, reaching $30/MWh by year-end, Berkeley Lab reports.
Prices for solar RECs remained relatively stable, and continue to exhibit wide variation across states, with the highest prices ($200-450/MWh) in New Jersey, MA, and DC.
The report was authored by Galen Barbose, a research scientist in Berkeley Lab’s Electricity Markets and Policy Department.
This content is protected by copyright and may not be reused. If you want to cooperate with us and would like to reuse some of our content, please contact: editors@pv-magazine.com.


By submitting this form you agree to pv magazine using your data for the purposes of publishing your comment.
Your personal data will only be disclosed or otherwise transmitted to third parties for the purposes of spam filtering or if this is necessary for technical maintenance of the website. Any other transfer to third parties will not take place unless this is justified on the basis of applicable data protection regulations or if pv magazine is legally obliged to do so.
You may revoke this consent at any time with effect for the future, in which case your personal data will be deleted immediately. Otherwise, your data will be deleted if pv magazine has processed your request or the purpose of data storage is fulfilled.
Further information on data privacy can be found in our Data Protection Policy.