The energy storage headlines have been popping – the Big Apple with a big battery, LA with record pricing, fire and grid shutdowns driving residential solar+storage, and every quarter a new record. With this, we’re getting comprehensive pricing information, and research that portends a great future. But shiny headlines don’t mean much if the hardware doesn’t make money, and especially if the regulators aren’t appeased.
With a specific goal of understanding battery performance for the purpose of describing financial viability in various use cases, DNV GL has released its 2019 Battery Performance Scorecard. And, a key thing to remember, the research that DNV GL creates on specific products, is available to end users seeking knowledge when they purchase (definitions of terms are provided below).
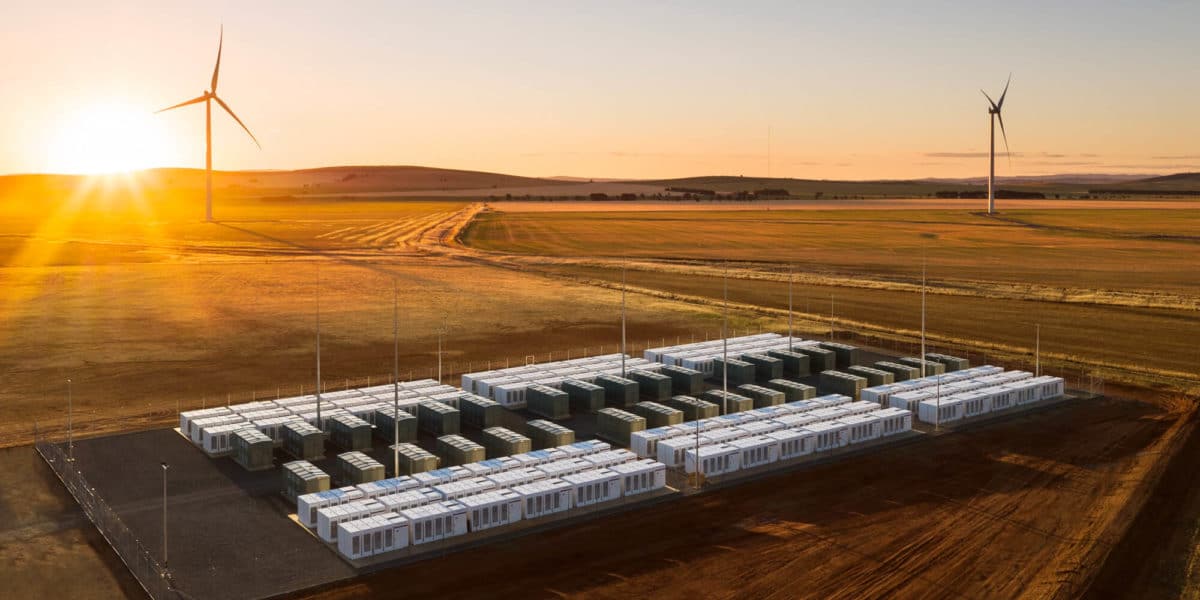
The group has increased the number of participants in the test—16 batteries—and increased the number of data fields to include nearly 500 individual battery test curves. DNV GL’s Product Qualification Program (PQP) tested four categories (above image) of “abuse factors”—average state of charge (SOC), SOC swing (or window), cell charge and discharge rate (C-rate), and temperature. The logic is that these four variables govern the battery’s degradation behavior, and understanding their impact on degradation provides information about replacement intervals, and therefore replacement costs, in the project financial model.
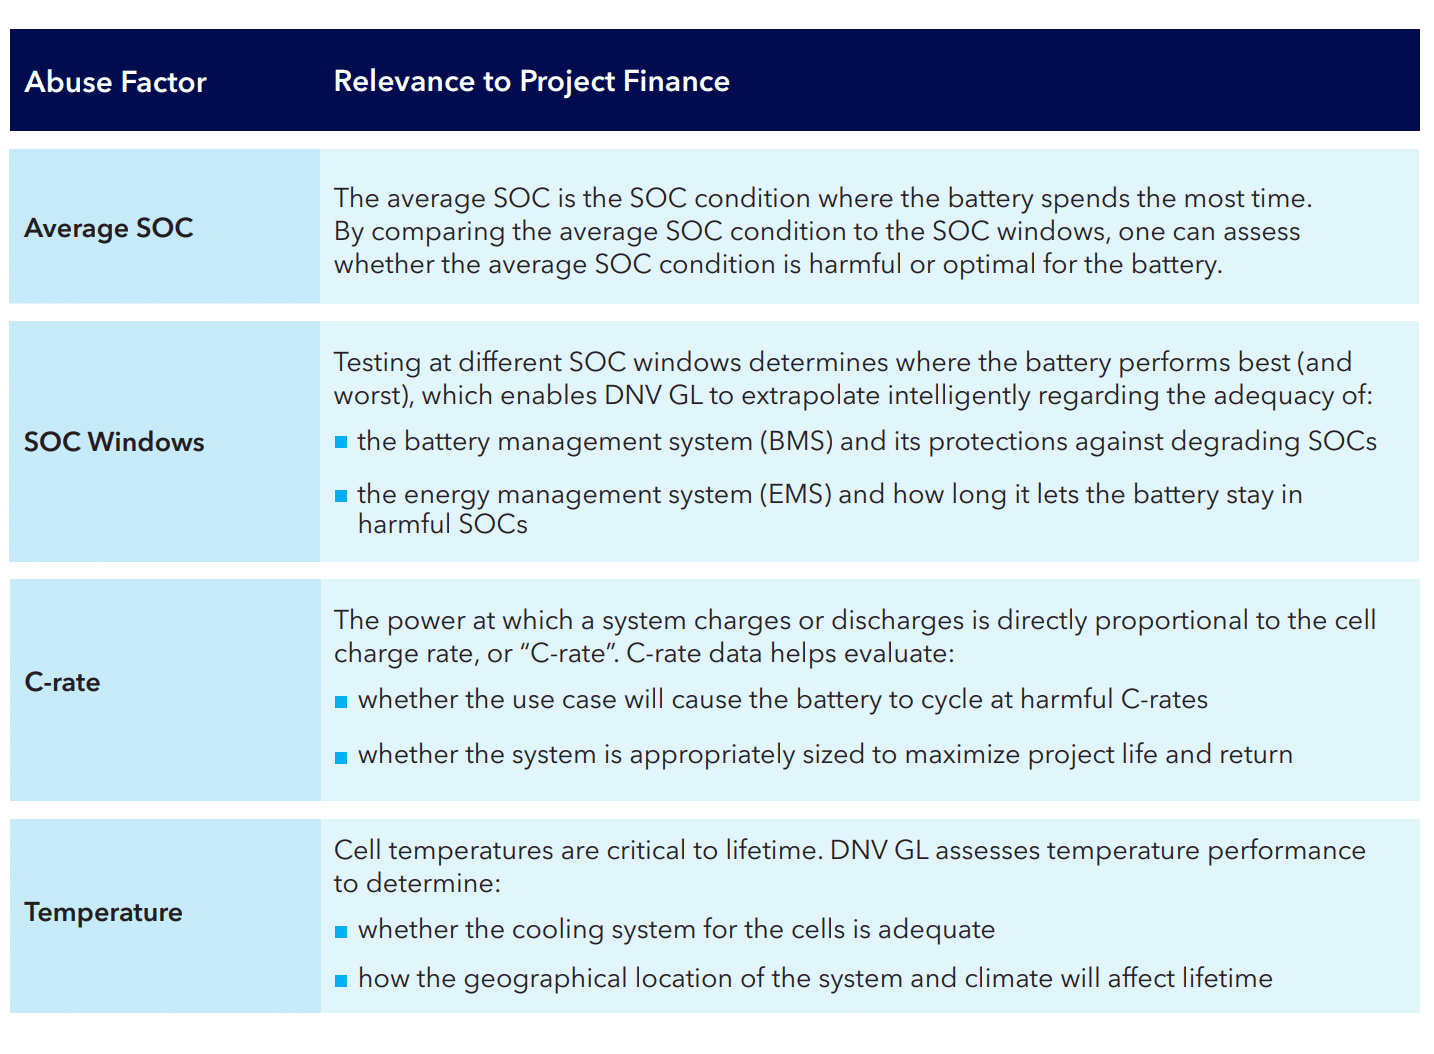
DNV GL also wishes to introduce a new term for us to consider versus “cycles” when considering battery lifetime, and that would be “throughput” (and sometimes “turnover”)—which essentially looks at the total amount of electricity that passes through the battery. The specific reason is that the first cycle of the battery’s life delivers more electricity than a cycle in year five, and since we depend on our battery to deliver specific amounts of electricity in each cycle, this datapoint becomes less valuable every day of use.
The above chart shows how the total amount of energy delivered per cycle changes as the batteries’ capacity falls due to degradation. SUSI Partners, who claimed to have launched the “world’s first dedicated energy storage infrastructure fund,” specifically says in their energy storage power purchase agreements that the battery must be able to deliver the contracted amount of electricity after ten years—meaning systems are often oversized on day one.
They also pointed out two other nuances regarding SOC and temperature. In the below left image you see that systems whose default state of charge tends to be a higher value tend to deliver less electricity over their lifetimes, whereas those that are held at lower SOC values deliver more. And on the right, you can see how temperature has an effect, and also that’s it’s important to look at the temperature chart over the long term. Note that initially, it might seem the 45°C battery delivers more juice, but notice how that tails off over time versus the 25°C system.


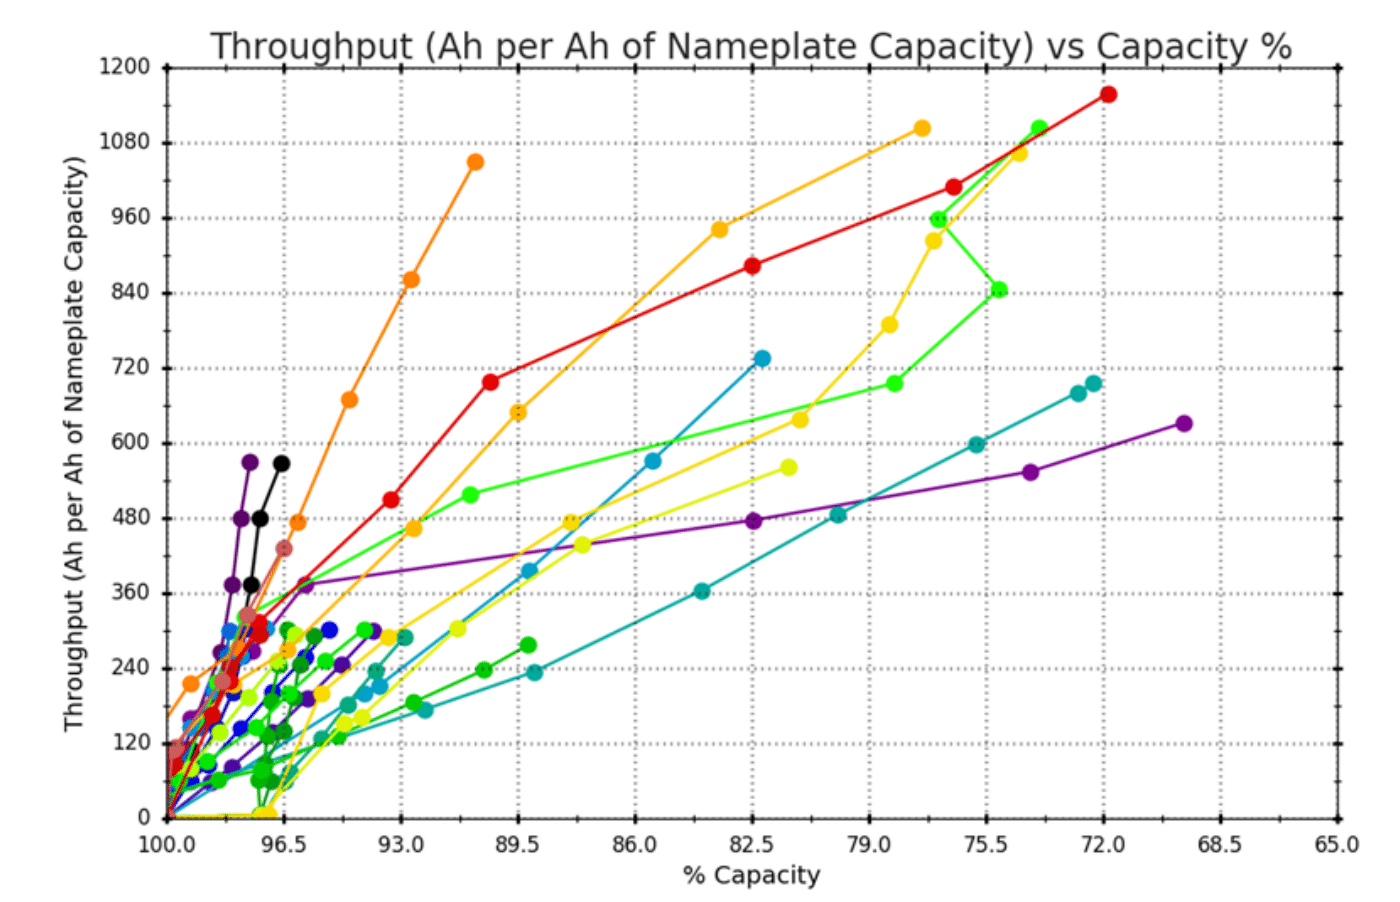
And with that logic of how and why above, let’s check out the results (below five images) of 16 batteries across four lithium ion-based chemistries: nickel manganese cobalt (NMC), nickel cobalt aluminum oxide (NCA), titanate oxide, and iron phosphate (LiFePO4), plus one non-Li-ion, non-flow battery with a proprietary chemistry. For each battery tested, the group shows best and worst temperature conditions, the least optimum SOC window, the best C-rate, plus measured throughput at or near these conditions. The purpose is to show the use case where each technology shines.


With the above chart, which blocks out the specific product names, you can see great variation in most data collected. For instance, optimum SOC range for some products is 100% through 0%, while others seem to operate best below 25% (??) or above 90%. The least optimum SOC range also varies, with half of the products not liking being fully charged, while two don’t want to be empty. Most of the hardware seems to perform best around 25°C, but interestingly, they vary in what their worst performing temperature is, with about half liking it warmer, and the other half liking it colder.
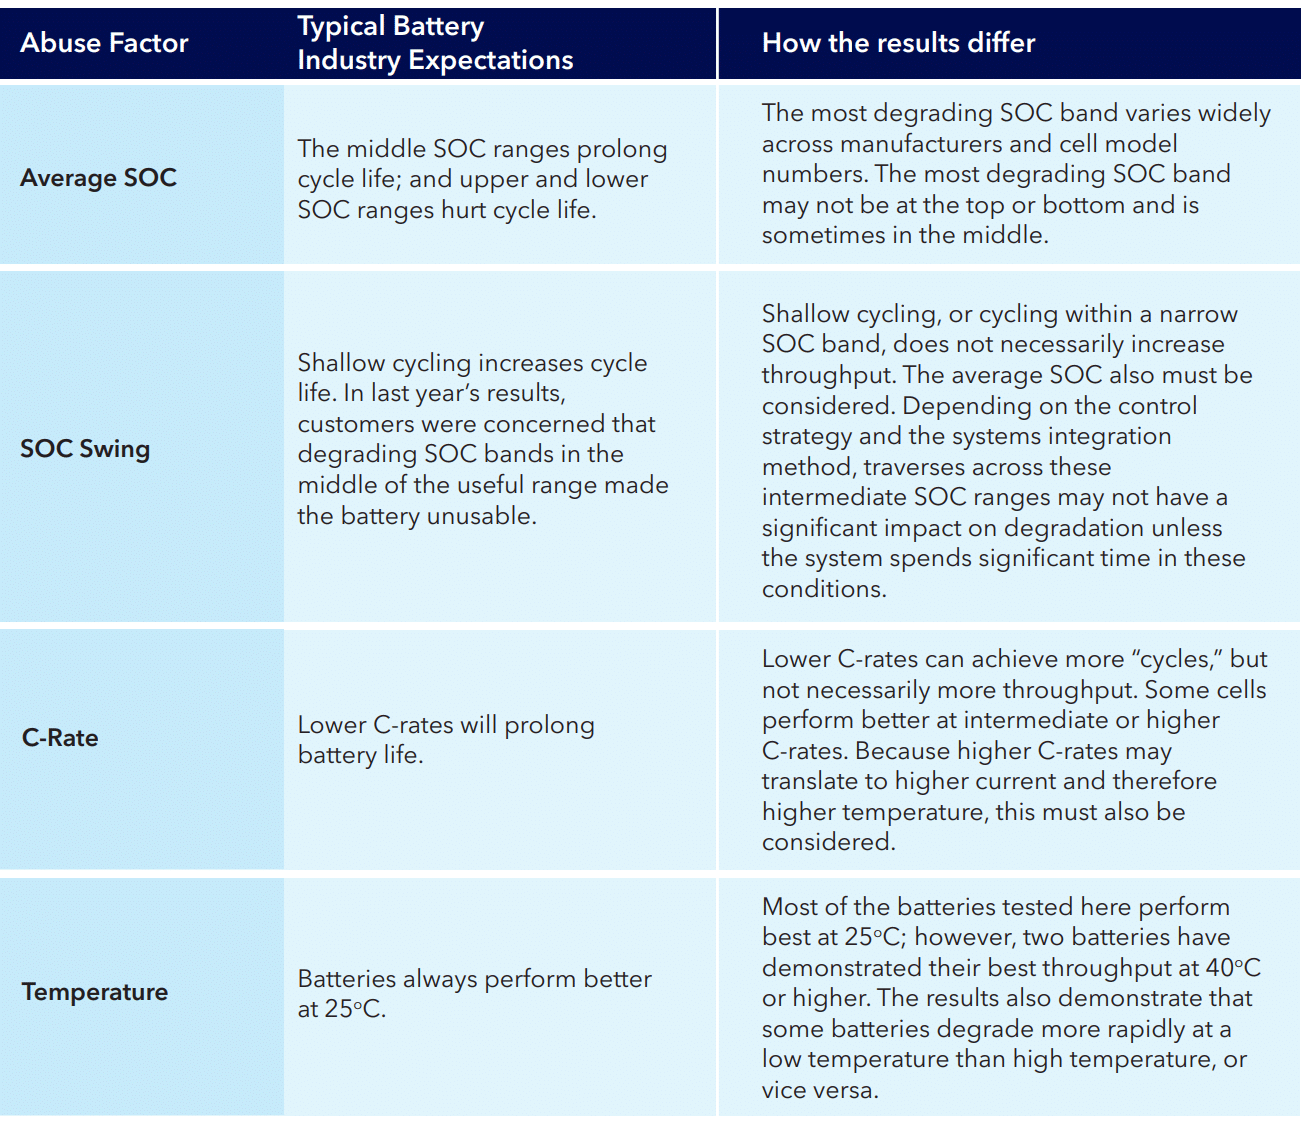
Below they show how their expectations differed from the end results.
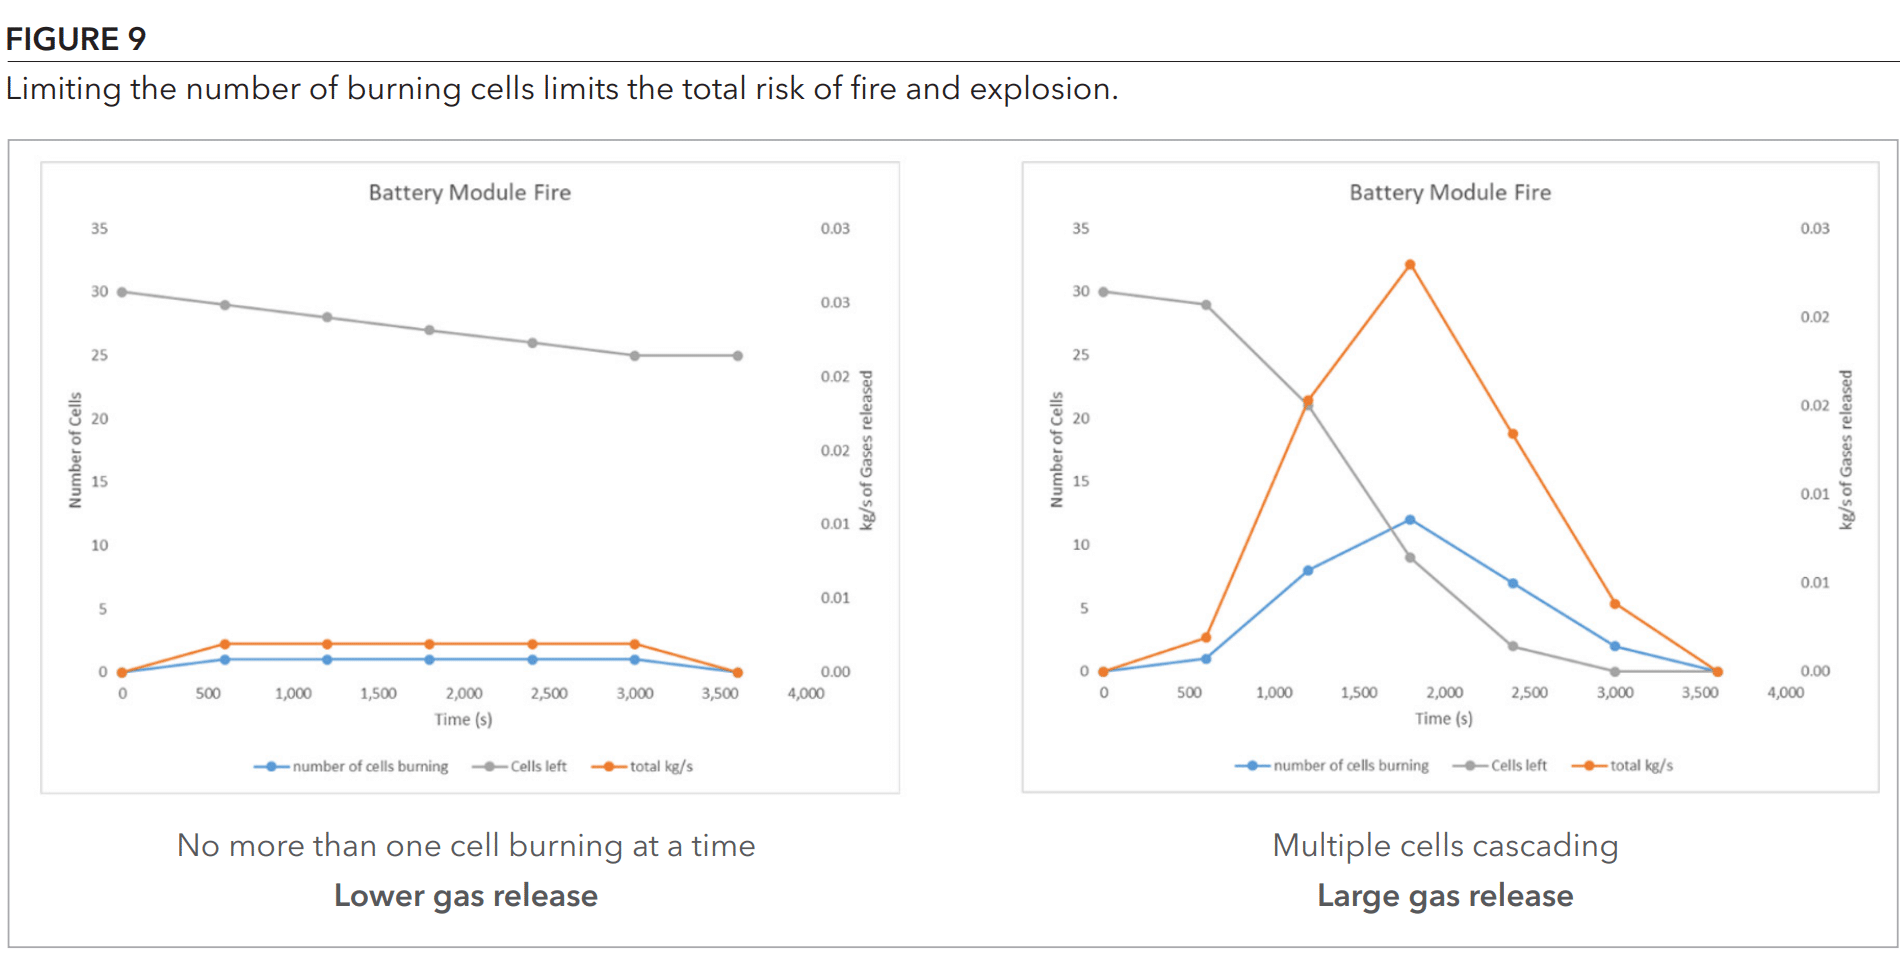
A few of their ten main takeaways are that chemistry is unequal to performance; spec pages and warranty don’t align – you need more documents; the battery and cell management systems matter a lot when considering chemistry; cooling matters; and as for safety considerations, ventilation, location, and number of cells directly connected drive complex events.
They also get into some fire safety testing, noting—interestingly—that water is the best way to put out a fire first, even recommending a water volume—0.1 GPM (gallon per minute [0.4 liter/per minute]) per kg of cells. However, they point out that cell to cell propagation of fires is one of the biggest factors when limiting thermal events.
And one last note—since 2016, DNV GL has seen some batteries increase in energy density by about 150%, and it is now possible to see Li-ion batteries with > 200 Wh/kg in usable energy density.
This content is protected by copyright and may not be reused. If you want to cooperate with us and would like to reuse some of our content, please contact: editors@pv-magazine.com.


So if I purchase a Flow battery such as a vanadium flow battery for my home use, (seeStoren or ESS) and there is no degradation for 25 or 30 years in the battery performance your numbers don’t make sense. SOC Really has no effect on the life of the performance of this battery.
Fires? Who cares about stinking fires, my battery will be buried and will not catch on fire, nor will it catch fire from a wild fire started by a utility.
you’re referring to lithium batteries based on a lithium chemistry of one type or another. These are bad investments because of their short lifespan. I guess Elon Might improve the density of the current batteries or maybe come up with a different lithium chemistry but he’ll still have the problem of battery fires. Not so with Flow Batts.
At some point people with money, are going to supply their own batteries and be their own utilities. End of statement. The utilities in California are being whippedsawed by bankruptcy attorneys. Meanwhile businesses do not have a reliable supply of power.. Homeowners are losing millions of dollars in food being stored in freezers.
No flow included in this study