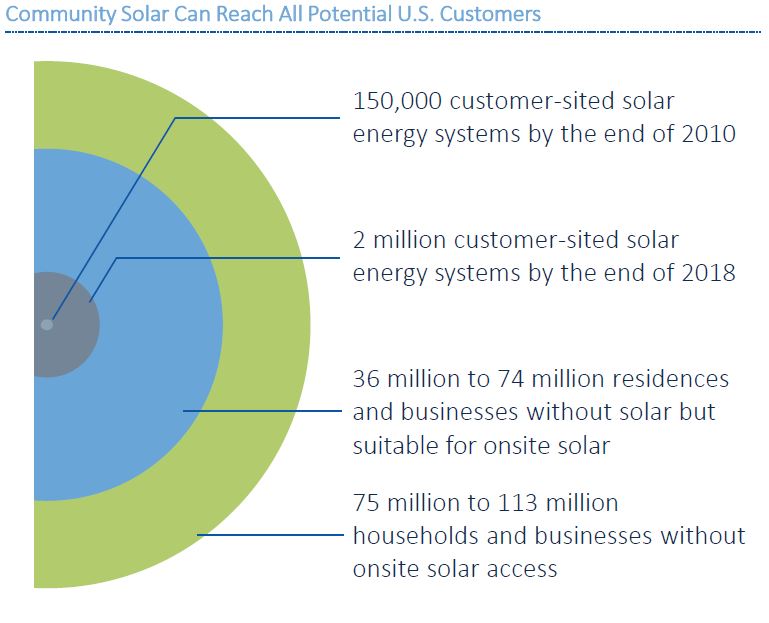
The United States is gaining on two million solar power systems connected to the power grid, and will get close to 65 GW of total capacity installed by the end of 2018. This is quant compared to NREL’s suggestion that we can get 39% of our electricity from our nation’s rooftops – representing just over 1.1 TW of solar capacity potential. And even though 83% of our nation’s small buildings have a suitable place for solar, 3/4 of all households don’t have ownership of their own roof or other suitable location to add solar power.
And that’s why Vote Solar commissioned GTM Research, who is now Wood Mackenzie, to develop The Vision for U.S. Community Solar: A Roadmap to 2030.
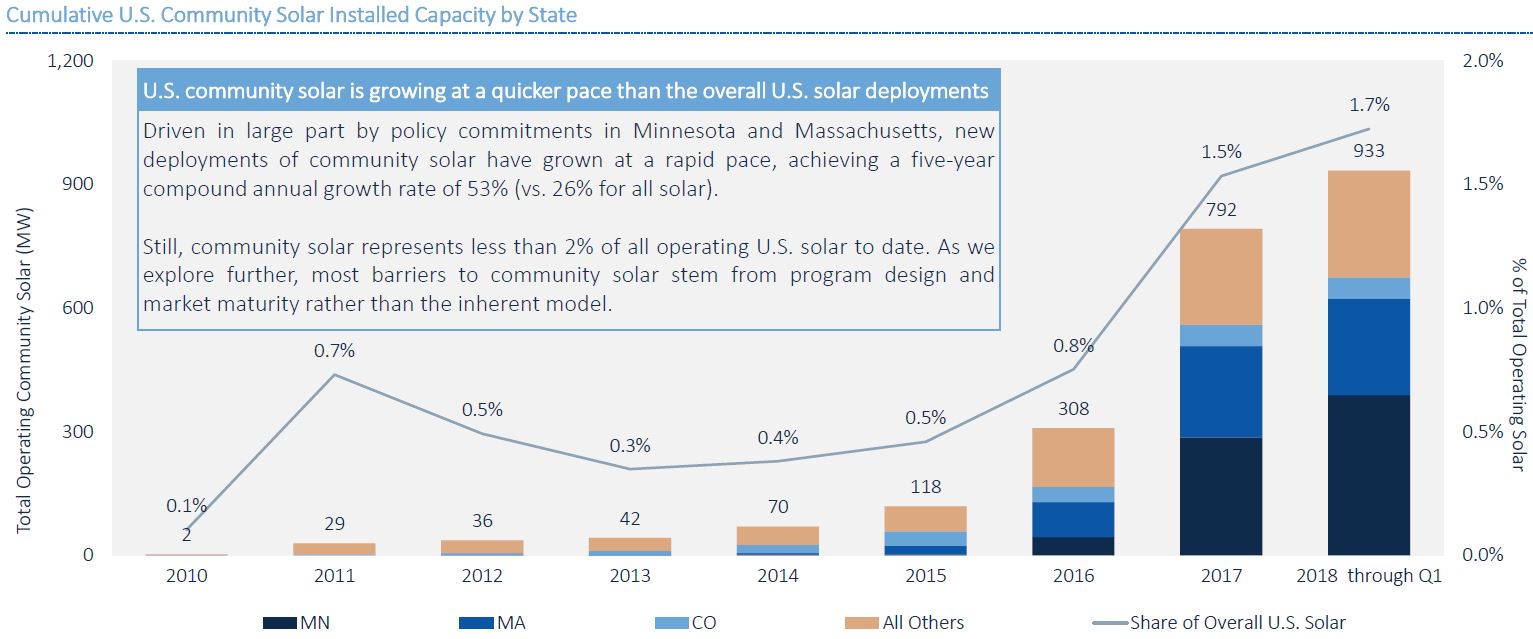
Currently, community solar power is focused in a few specific marketplaces that have developed the proper legislation. Minnesota is currently leading the country with about 41% of all volume deployed in 2018, and Massachusetts follows with a strong 25%. After that though – Colorado is over 5%, before the rest of the states and territories spread the other 27%.
Minnesota and Massachusetts have very directed community solar programs spelled out in their policy designs. The electric utilities have been forced to implement systems supporting these programs. 2018 volume, 141 MW so far, is moving at a slightly faster pace than 2017’s 484 MW deployed – and sometime during the 2nd quarter passed the 1 GW deployed nationally mark.
But from the perspective of GTM Research and Vote Solar, we’re now just 1/80th of where we could be in just over 11 years – the key though is the work we do now to structure the policies that will drive growth tomorrow. This includes enabling policy in new markets, expanding existing programs further, continued program design and evolution – specifically to figure out how to add in low and moderate income household, as well – and so very important – product innovation by the community solar developers, either through financiers behind them or connecting closer with customer finance of projects.
The financial innovation aspect of community solar is so very important because people want to save money from solar power – that’s number one on the list, no questions asked. GTM Research delves much further into the below chart to break out various groups – for instance, the ‘typical’ residential customer wants tangible savings after predictability of costs, while the larger populations of low and moderate incomes, plus affordable homes want tangible savings. Larger, non-residential customers also aim for more predictability.
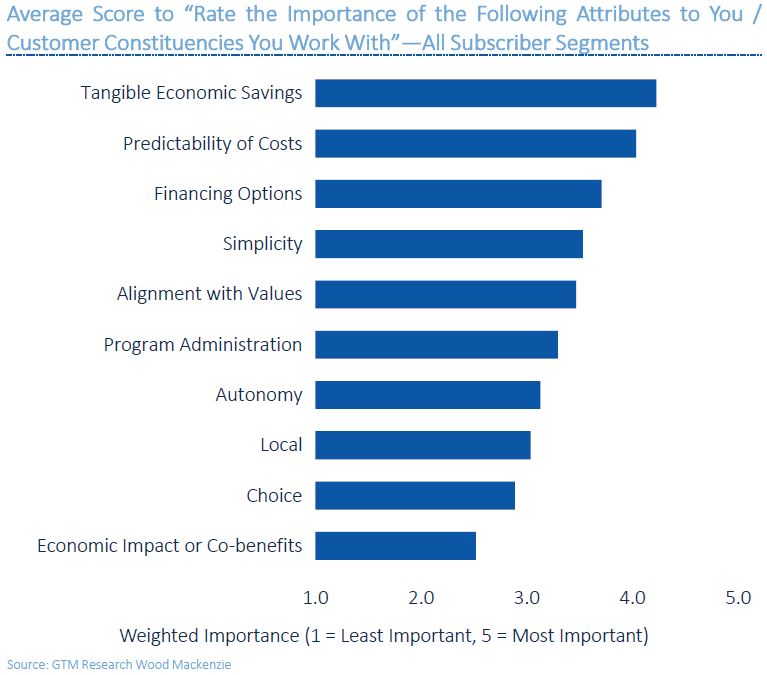
pvmagazine believes that this chart might be the most important one for community solar developers to swallow – “tangible economic savings” are not equal to 1-2¢/kWh! We believe that if customers are to buy into community solar, they need payoffs like rooftop customers get – and that’s probably going to mean partial ownership along with money down. This will necessitate financier product evolution.
GTM Research sees the evolution of community solar in three phases:
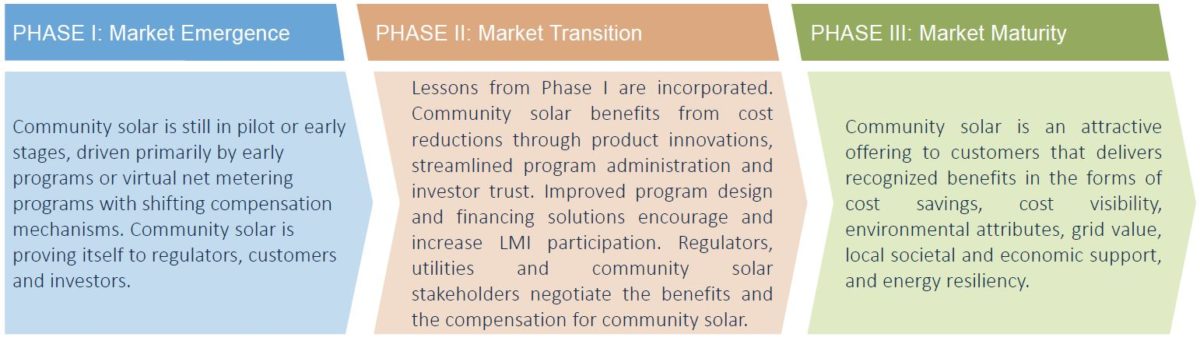
The report delves deeply into what it will take in each phase to move forward. Initially, setting up programs that move smoothly – allowing easy in and out access, large enough program sizes, transparent billing, simple contracts, low lag time, and a greater appetite for FICO score risk by financiers.
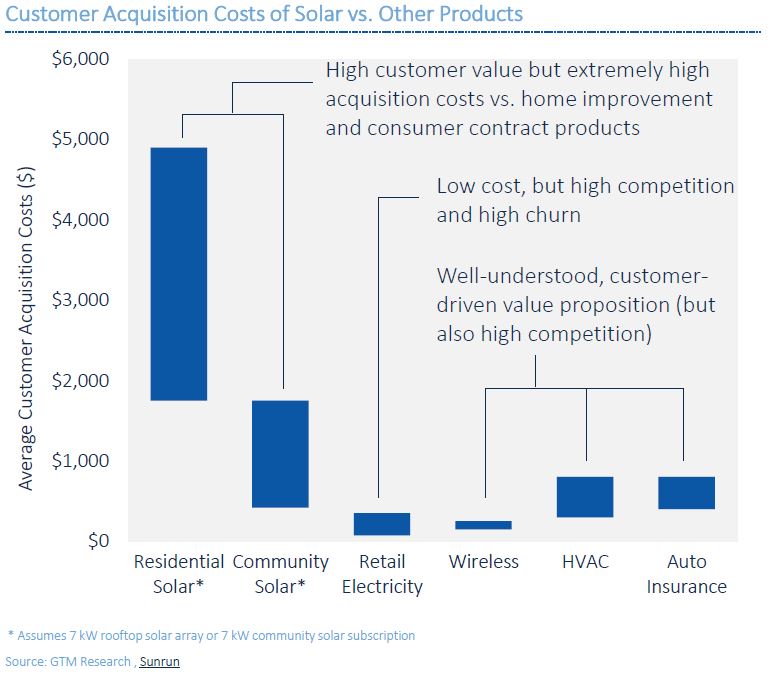
And since demand number one from customers is that they get a good value, one of the keys pushed by GTM Research is that these programs must push costs down. Customer acquisition cost was heavily referenced – and the only thing that seems to cost more to acquire than a community solar customer , is a residential solar installation. GTM Research does project that community solar all in costs will fall 42% from $2.02/W in 2017 to $1.17/W installed in 2030, but this is mostly being driven by broader solar power costs dropping – and nothing special being done by community solar developers.
Another very innovative way for community solar owners to lower overall electricity prices is to actually pay these medium sized installations their fair worth. On the extensive list of “Potential Value of Solar Components” that ought be financially recognized by the electric utilities and broader policy:
- Energy
- Capacity
- Ancillary Services
- RECs+Environmental Compliance
- Planned distributed upgrade replacement, capacity expansion, asset replacement, reliability improvement, power quality improvements
- Grid/Distribution Services
- T&D losses
- Risk Hedge
- Social Benefits
- Economic Development
A key aspect of developing community solar is connecting with low, and moderate income, and affordable housing – as these households represent 50% of the market. The focus here is on ownership of the assets, how the community solar bills flows from those owners through the utility and to the customers, and how to integrate HUD into the solar subscription model.
The report then delves into details for each of these areas – financier policy, market policy, asset owner ideas, and utility innovation. There’s also a map for rolling out California, Florida, Michigan, and New Jersey.
Broadly speaking, community solar is a massive opportunity that’s a result of a massive challenge – people who want solar power, but don’t have the roof. Half of these folks are economically challenged, while much of this group is small business and city living. There is an 80 GW opportunity, equal to 150% of cumulative installations at the end of 2017, and the treasure hunt has already begun.
This content is protected by copyright and may not be reused. If you want to cooperate with us and would like to reuse some of our content, please contact: editors@pv-magazine.com.


By submitting this form you agree to pv magazine using your data for the purposes of publishing your comment.
Your personal data will only be disclosed or otherwise transmitted to third parties for the purposes of spam filtering or if this is necessary for technical maintenance of the website. Any other transfer to third parties will not take place unless this is justified on the basis of applicable data protection regulations or if pv magazine is legally obliged to do so.
You may revoke this consent at any time with effect for the future, in which case your personal data will be deleted immediately. Otherwise, your data will be deleted if pv magazine has processed your request or the purpose of data storage is fulfilled.
Further information on data privacy can be found in our Data Protection Policy.