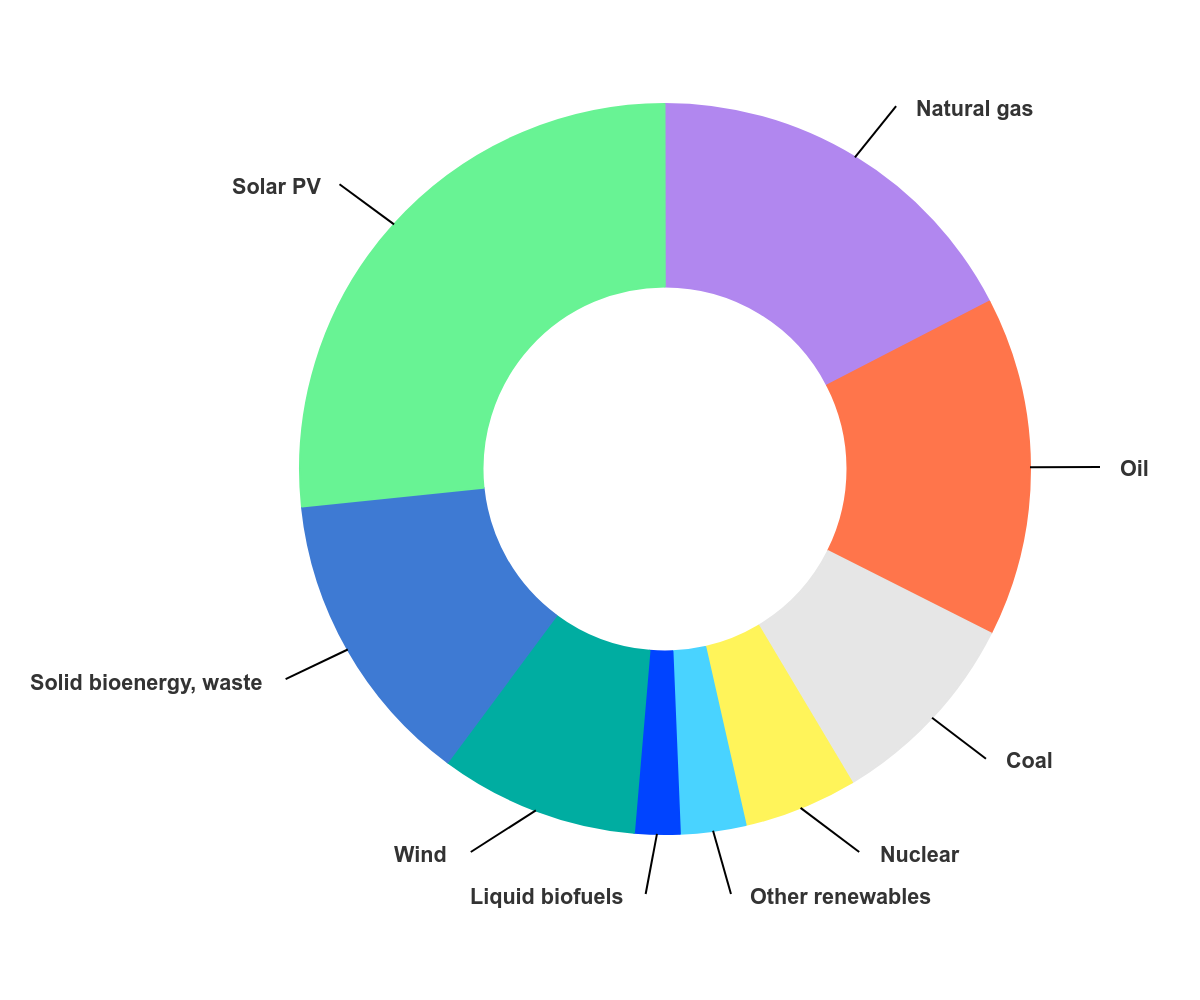
According to the 2026 edition of the International Energy Agency’s (IEA) Global Energy Review, solar photovoltaics accounted for 27% of the world’s growth in demand for energy in 2025, the first time on record that a modern renewable source contributed the largest share of growth in global energy demand.
The world added 605 GW in total capacity additions from solar PV, a growth of 12% over the previous year’s additions for the technology. China accounted for nearly 61% of those additions, leading all world regions with 368 GW of new solar compared to 324 GW in the prior year.
The European Union came in second with 68.7 GW of new solar, exceeding its 64 GW total in 2024, while India took third place, with 48.3 GW of new solar. The United States added 43.1 GW of solar in 2025, representing a 13.8% decrease in year-over-year additions.
Overall, world energy demand increased by 1.3% over the previous year, or 8 exajoules (EJ). Increases in raw demand were again led by China, with a total of nearly 3 EJ, with the U.S. demand growth representing 1.8 EJ.
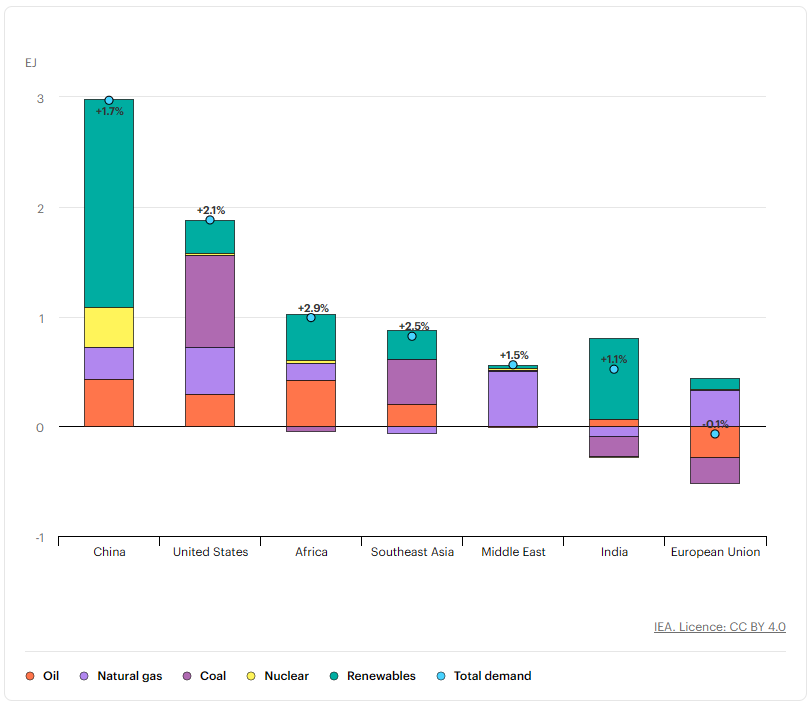
Image: IEA (2026) Paris, CC BY 4.0
However, the technologies that drove demand growth differed widely between the two superpowers. Nearly 77% of China’s new demand (2.3 EJ) was served by renewables and nuclear, while fossil fuels accounted for the other 23%. In the United States, fossil fuels accounted for 83% of the increased demand (1.5 EJ), with coal alone representing over 44% of the increase.
The report says the increased demand from coal in the United States resulted from gas-to-coal switching as a result of higher natural gas prices, along with strong growth in electricity demand due to a cold winter. With its relatively strong economy throughout the year, U.S. demand for gas and oil also grew.
The Age of Electricity
With global demand for electricity growing around 2.3 times faster than total energy demand, the report’s authors claim the data confirms “the arrival of the Age of Electricity.”
Demand from data centers and electric vehicles increased worldwide 17% and 38%, respectively, but industry, household appliances and commercial buildings (excluding data centers) accounted for most of the world’s total electricity demand growth.
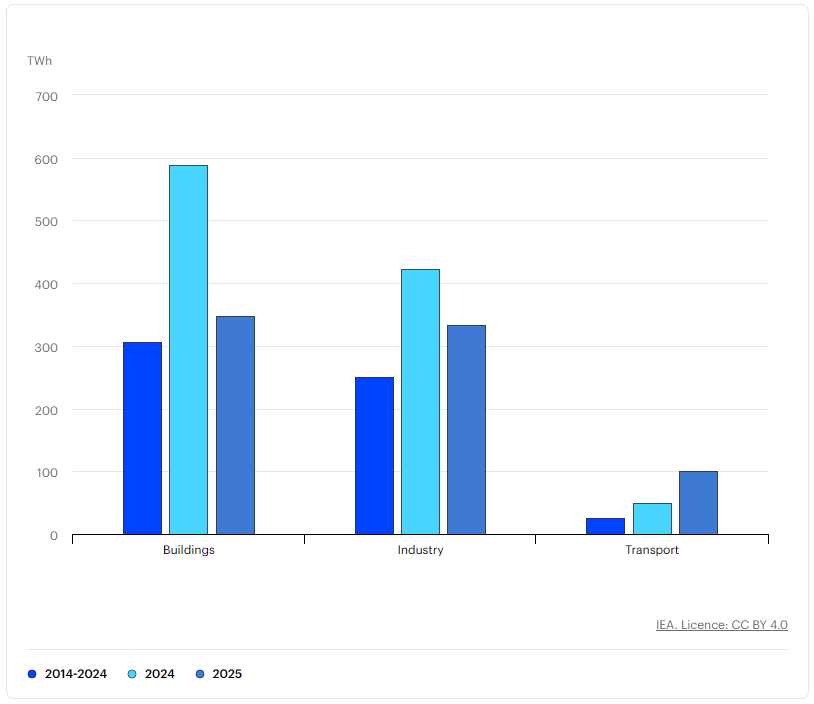
Image: IEA, Paris, CC BY 4.0
Worldwide, electric car sales increased by more than 20% year-over-year in 2025, while sales of heat pumps fell by about 2%.
Once again, the United States bucked global trends; data centers accounted for 50% of total electricity demand growth in the country, while sales of electric vehicles were flat and heat pump installation fell by nearly 13%.
More information, analysis, and interactive data available from the IEA.
This content is protected by copyright and may not be reused. If you want to cooperate with us and would like to reuse some of our content, please contact: editors@pv-magazine.com.


By submitting this form you agree to pv magazine using your data for the purposes of publishing your comment.
Your personal data will only be disclosed or otherwise transmitted to third parties for the purposes of spam filtering or if this is necessary for technical maintenance of the website. Any other transfer to third parties will not take place unless this is justified on the basis of applicable data protection regulations or if pv magazine is legally obliged to do so.
You may revoke this consent at any time with effect for the future, in which case your personal data will be deleted immediately. Otherwise, your data will be deleted if pv magazine has processed your request or the purpose of data storage is fulfilled.
Further information on data privacy can be found in our Data Protection Policy.