The sun rises every day, and hundreds of billions of dollars of portfolios set their rates of return on it.
Clean Power Research collects data from satellites, and packages it into equations that quantify historical solar insolation. The one-square-kilometer data allows solar power developers to project the future and secure financing for power plants. During the first half of 2019, the group saw generation fall across much of the country — enough to make a banker blanch.
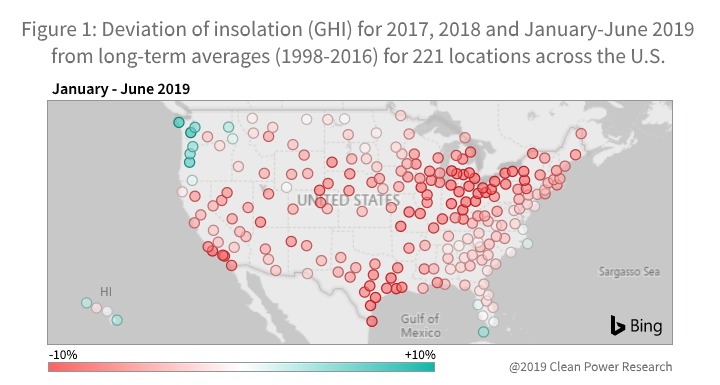
First, an explanation – the rain comes and goes. Through April of 2019, NASA measured the 12 wettest months on record with precipitation in the lower 48 states at 17% above average. In the image from Clean Power’s H1’19 analysis, we see lower generation across much of the country, with a few areas average and a couple of touches of higher than average as compared to 1998 to 2016. California, with more than 50% of the nation’s installed solar, saw between 5 to 10% less solar production. Just an average year might mean we see last spring’s records easily broken.
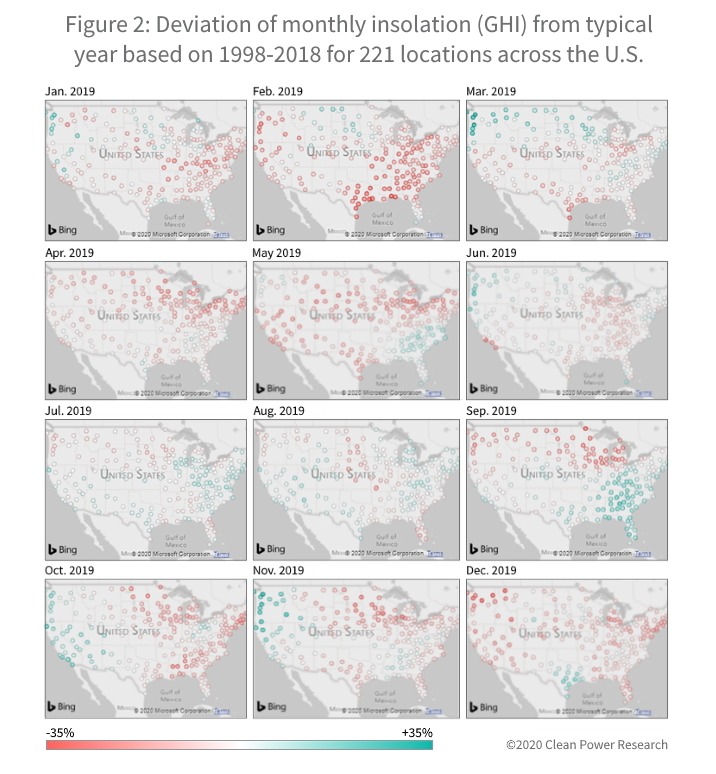
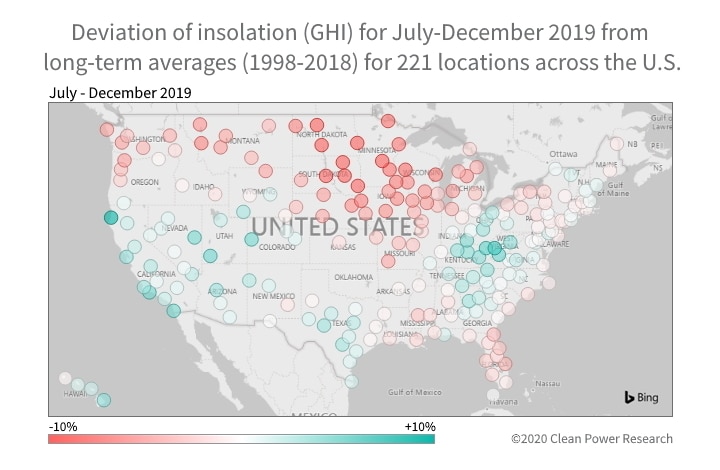 However the second half of the year, in the bottom image, saw enough generation in some areas to bring the whole of 2019 numbers close to historical averages. However, the upper midwest has now had two straight years of lower than average numbers – ranging from 5 to 9% down. Looking at the monthly chart for 2019 at the bottom of this article, you can see how every month has some level of variance to consider. That chart is probably a great tool to teach customers about variability.
The company sells the data – in the forms of the past, present, future and utility scale – in the SolarAnywhere® product family. First, FleetView® was developed to support utilities. Clean Power Research told pv magazine that utilities are actively integrating renewables and energy storage in large installs, but also distributed energy resources like rooftop solar, electric vehicles, and home and business battery storage.
Lead Product Manager Patrick Keelin said,
Where historically there were only loads, there is now generation. What are the impacts on the utility manager’s ability to regulate other power quality factors – like voltage. The data is targeted toward engineering groups, who are asking ‘what is the true load on my system and what are the potential impacts of rooftop solar on power?’
Then, there’s SolarAnywhere®‘s Data and Forecast. Data offers uninterrupted satellite data that goes back to 1998. Clean Power says in-depth validation against ground sensors and blind studies have found satellite system data to be pretty accurate over long periods. Data is offered up in one-kilometer squares, with each square having its own solar resource and weather estimates.
SystemCheck® let’s you model how individual systems should be performing against real time weather. The company sells it to fleet managers who compare predictions versus their data of actual generation. And Forecast let’s you look up to seven days ahead, and a climatological forecast is available forward five days and through 75 days ahead. Forecasts are available in as little as one minute increments, and including include wind, temperature, weather, and of course generation projections.
Keelin says the more sophisticated customers use a suite of tools:
The data is available in forecast, realtime and historical – with each used for different purposes. Third party residential portfolios owners might have 10,000 to a couple of hundred thousand systems and they want to know what a broad region of performance data actually means. First you get your local system’s performance data, your soiling data, and add a tool like us to understand how the weather is. Then you can really pull things apart, you can get to the things you can really control.
And unique to many folks, you get pricing on the website.
This content is protected by copyright and may not be reused. If you want to cooperate with us and would like to reuse some of our content, please contact: editors@pv-magazine.com.


Does the deviation of solar insolence explain the practice of having a D.C. to A.C. ratio of something like 1.3 to 1.5 or more D.C. to 1 A.C. ? Just 15 to 20 years ago, solar PV was ‘calculated’ tight and thin before installation. Now the price point of solar PV panels is at a ‘value’ that one can ‘calculate’ in first year degradation, degradation due to dusting of panels, temperature extremes in desert areas that effect panel harvest efficiencies. It is quite possible to design a solar PV farm that will last and put out ‘required’ energy over a 50 year period.