
We’re a long way from the land of milk and honey, but on Easter Sunday – for about an hour – we got a taste.
On Sunday, at 1:55 PM Pacific Time the California Independent Systems Operator (CAISO) reported that greenhouse gas emissions necessary to serve its demand (~80% of California’s electricity demand on an annual basis), was measured at a rate -16 metric tons of CO2 per hour. Five minutes later, the value was -2 mTCO2/h, before it crept back up to 40 mTCO2/h at 2:05 PM PST. At 2:10 PST though it fell back to -86 mTCO2/h and stayed negative until 3:05 PM PST.
This information was brought to the attention of pv magazine via tweet from eagle eye Jon Pa after CAISO’s site first noted the negative values:
@SolarInMASS California ISO has negative CO2 emission Easter Sunday afternoon. pic.twitter.com/QoCZNZ5kOR
— Jonathan Papai (he/him) (@JonathanPapai) April 21, 2019
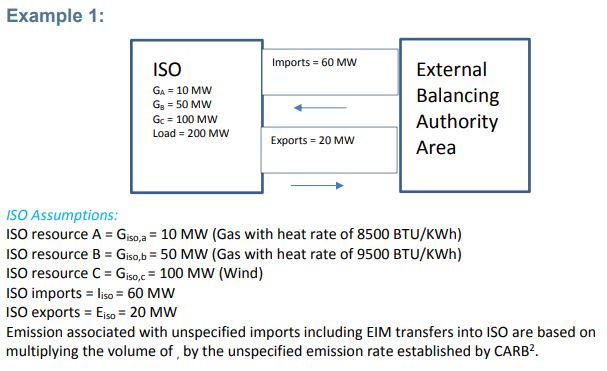
The region was still generating CO2 though, as natural gas, biogas, biomass, geothermal and even coal plants were running and pumping out emissions. CAISO’s Greenhouse Gas Emission Tracking Methodology, December 28, 2016 (pdf) notes the below calculations to create the value what it terms, “Total GHG emissions to serve ISO demand”:
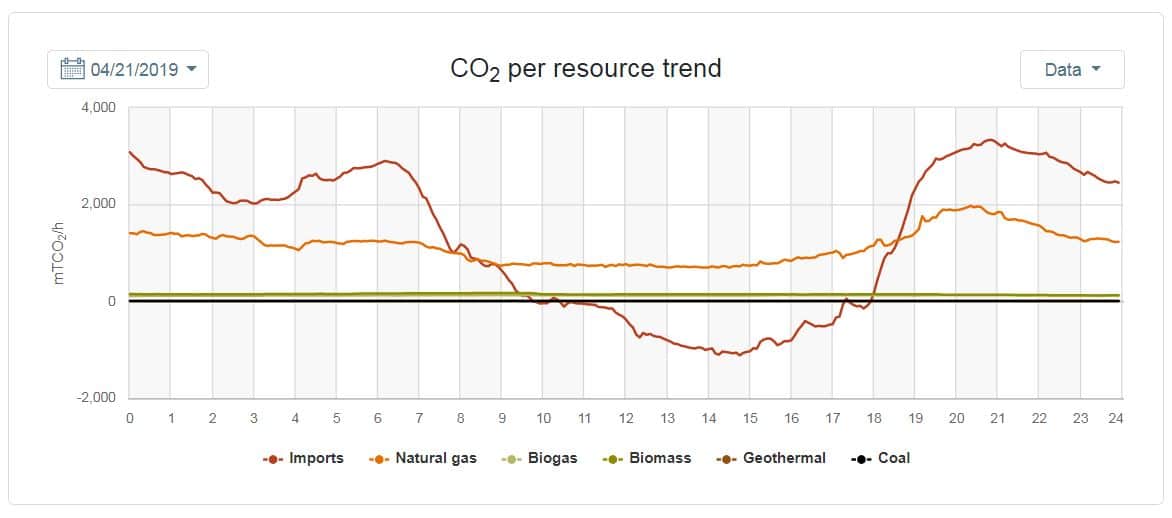
Of importance to note is that to get to the net negative value, CAISO considered all electricity imports and exports. And as can be noted in the image below the CO2 intensity of imports during the day rapidly declined as the sun came up, first going negative around 9:05 AM PST, and mostly staying so until just before 6 PM PST.
During this same weekend, other records were noted (reiterating that we’re in record setting season) such as a new electricity export record of greater than 2 GW and total renewable electricity as part of total demand at greater than 70%.
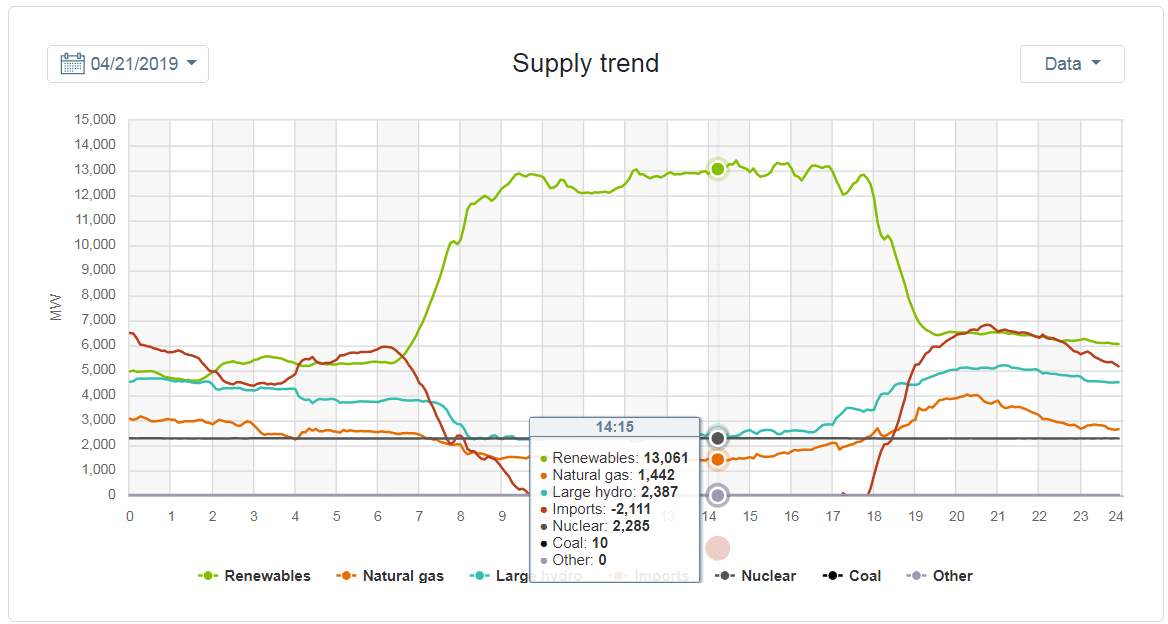
At the peak negative moment of 2:15 PM PST, -112 mTCO2/h seen below, the total amount of clean instantaneous generation being used in the power grid region was 17 GW, with renewables giving 76% of the total, hydro 14%, nuclear 13% and imports of -12% countering the CO2 coming from just over 1.4 GW of gas generation.
Also of importance are a few layers of nuance in the electricity demand charts. First off we’re in the shoulder seasons of California – nice cool weather before the warmth of summer drives air conditioning demand. Additional the weekend electricity demand is always lower, as well, Easter Sunday might have had an affect.
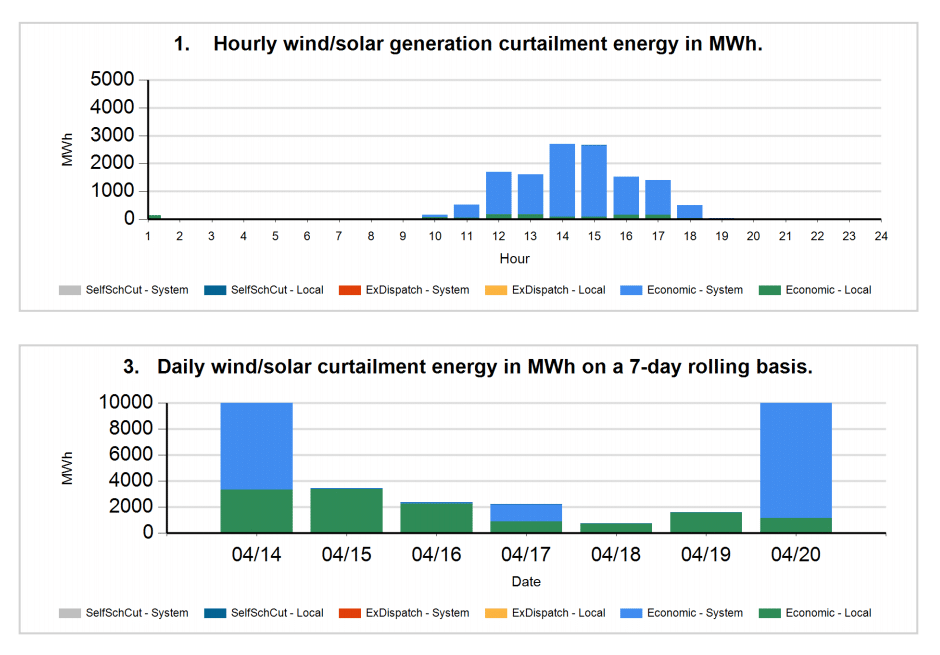
Lastly to note was the amount of electricity from solar and wind generation being curtailed. And while the Sunday numbers weren’t available yet, the below image noted Saturday with 10 GWh in total being curtailed (pdf) – peaking at over 3.2 GW of instantaneous mostly solar power in the hours of 2 and 3 PM PST. On an annualized basis, less than 2% of total potential solar electricity was curtailed in 2018.
This content is protected by copyright and may not be reused. If you want to cooperate with us and would like to reuse some of our content, please contact: editors@pv-magazine.com.


The counter-balance to theoretical emission reductions are the almost annual forest fires emissions. Who is to blame: A serious effort to manage California’s vast forests, starting with the State Government.
Terrible headline! What are you promoting with this story?.. Great modeling, which gives the reader an understanding of how electricity is produced and moved throughout an RTO; but come on, too much clean energy? How about “California Reversed Climate Degradation on Easter Sunday. Clean Sustainable Energy is on the Rise!”
Hello Mr. Ehrenberg,
We discussed this headline internally, and it was more important to our publication to describe what happened accurately (that renewable energy generation exceeded demand), than to put a positive spin on it.
You can expect similar decisions from us in the future; we’re in the business of facts, not PR.
John,
In your description of the rate of CO2 production the first number mentioned was “-16 mega tons of CO2 per hour.” Subsequent references were abbreviated mTCO2/hr. To me it didn’t jibe that “mega” would be represented by an “m” rather than an “M”. After rummaging around the Caiso website, I think the “m” means “metric” instead of mega. Agree-ez vous?
Fixed! Thank you for that.
One “metric ton” is 1000kg, or 1 Mg. While it may be reasonable to refer to it casually as a metric ton, if you’re abbreviating it anyway why not use Mg, an SI unit, instead of mT? 1 “mega metric ton” is 1 teragram, or 1 Tg. A ton is not a metric unit.
I tried following exactly how the documentation provided by the state was delivering it.