The price of electricity is still going up a small bit, but recently it has been because of power grid upgrades in spite of the wholesale price of electricity going down. One nuclear proponent asked, “If solar and wind are so cheap, why are they making electricity so expensive?” – the answer is: they are cheap, and they aren’t making it more expensive – in fact, the data suggests the more wind and solar there is the lower pricing gets. With recent record low prices from US based solar+storage, and solar alone globally – expect these decreases to continue.
A study from the US Department of Energy’s Lawrence Berkeley National Laboratory (LBNL), Impact of wind, solar, and other factors on wholesale power prices: An Historical Analysis, has looked at the changes in the wholesale price of electricity across the United States between 2008 through 2017, from wind and solar power, as well other sources.


The research has found that the greatest effect through the whole decade is due to gas pricing going down strongly from 2008 through 2012 as the shale boom expanded (above left image). From 2012 through 2017 this shifted (above center image), with gas still having a great effect, but with the wind and solar boom beginning to take hold and having a greater effect – especially when considered more locally, seasonally, and in heavily deployed markets. And then looking forward from 2017 through 2022 (above right image), where wholesale costs are projected to increase – having the majority of the price slowing effect.
The report showed (below image) that where wind and solar penetrations were the greatest – the California Independent System Operator (CAISO) for solar and the Midcontinent Independent System Operator (MISO), Energy Reliability Council of Texas (ERCOT), and South Power Pool (SPP) regions for wind – the price declines due to these resources were the greatest.
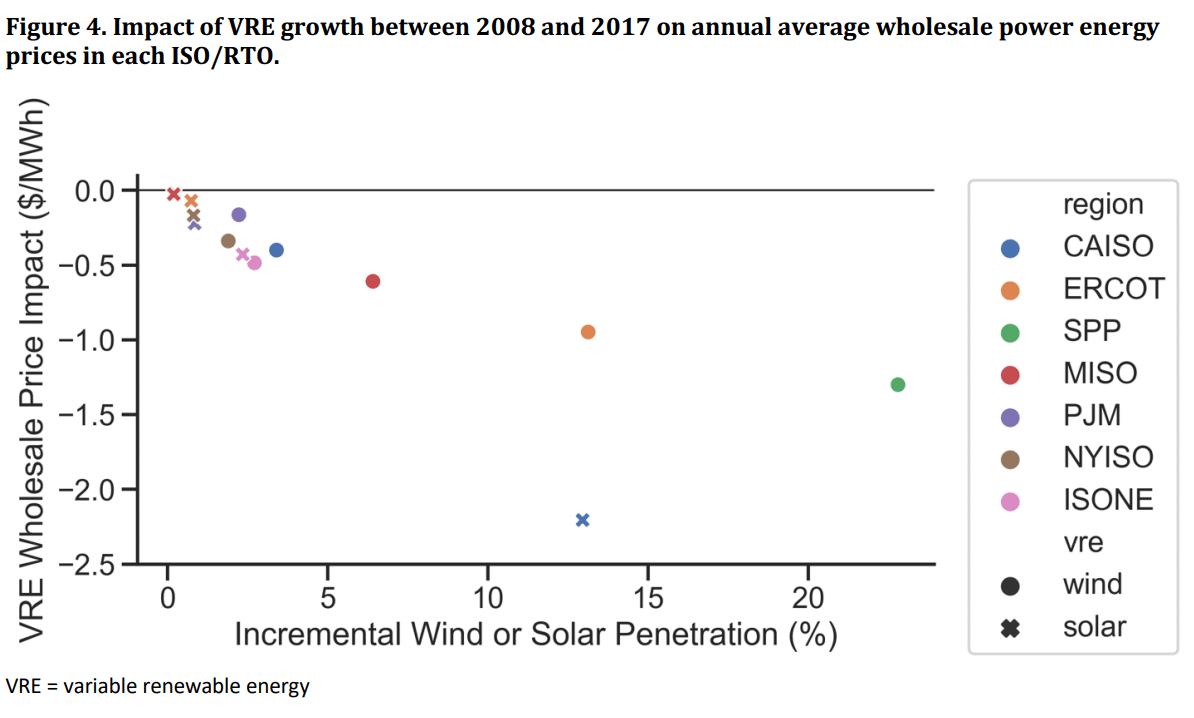
Within these regions, the markets showed variable reasons for their price declines from wind and solar. CAISO is the leading market for solar power in the nation representing a third of all solar power installed, and of course, had – by far – the greatest effect from solar power in the above chart.
The researchers suggested CAISO was the canary in the coal mine, perhaps foreshadowing greater impacts from solar in other regions as solar penetrations grow. The solar impact in CAISO is driven by;
Solar more frequently shifting the net demand in the steeper part of the supply curve and therefore having a larger impact on prices with and without solar. The alignment with the steeper part of the supply curve is due to solar in California reducing net demand during summer afternoons, when marginal generators tend to be less-efficient peaker plants.
Another unique happening due to wind and solar power are negative pricing moments. They are primarily driven by heavy production from wind and solar.
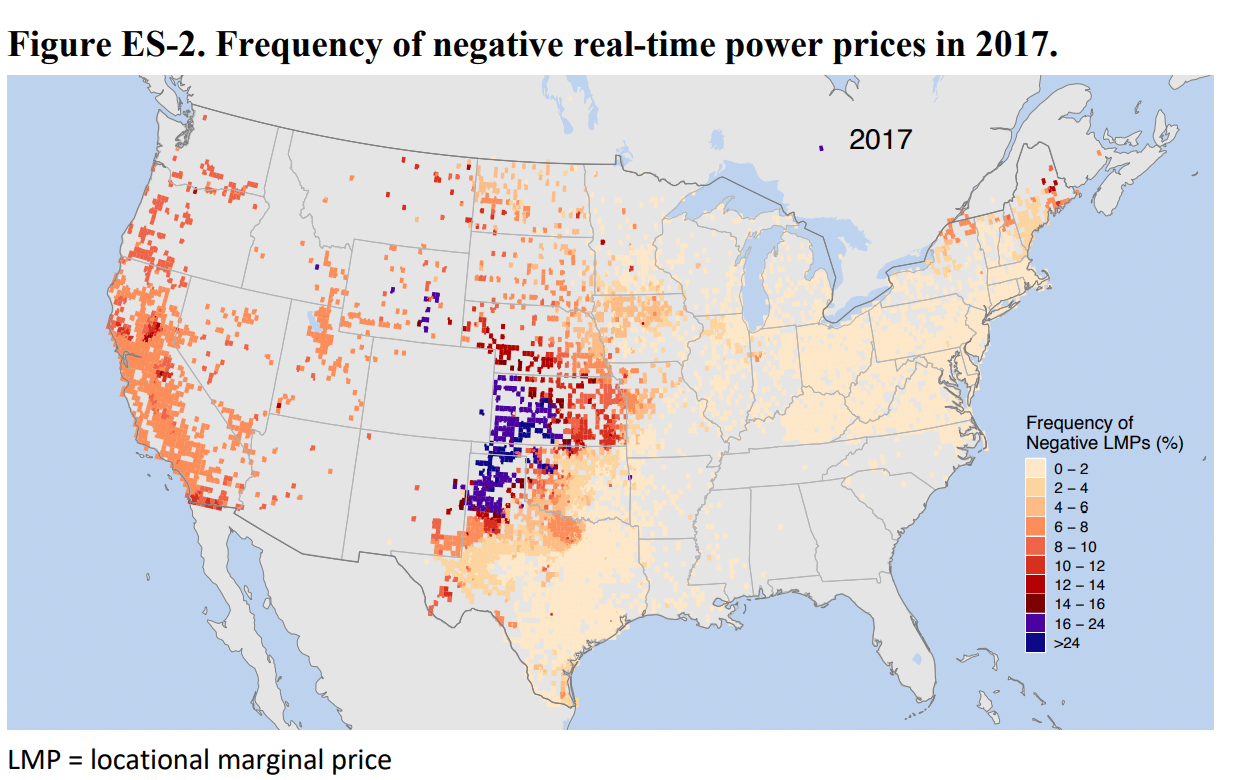
The research found that the “percentage of nodes with negative RT prices during 5% or more of all hours grew rapidly between 2015 and 2017.” There were some nodes with pricing of this nature in the pacific northwest due to wind and hydro electricity in the 2010-2012 period, but transmission upgrades allowing for exports have allayed much of that.
Looking out in the future, the authors projected nationwide wholesale price increases for a variety of reasons – even projecting an increase in gas – with wind and solar prices, especially in California, offering some of the only downward pressure.
This content is protected by copyright and may not be reused. If you want to cooperate with us and would like to reuse some of our content, please contact: editors@pv-magazine.com.


How do you account for the cost of homeowner ,business and governmental installed solar?
Pushing solar and wind to supply base load is going to come up against some hard realities. Without huge installations of batteries or other energy storage devices you cannot provide both economical and reliable supplies of electric power.
Lots of batteries will be installed, as well, wind+solar+hydro running on a much more refined grid that includes cars and demand management
But if you install lots of batteries or other storage, it no longer stays “economical.” Case in point–a solar setup to match my home’s electricity consumption would cost around $20k. Battery backup so I can disconnect from the grid would cost ~$15k, and possibly more. It’s a dilemma–either lose money when you overproduce or lose money for storage.
The better approach is to use the smart grid to time-shift consumption. For example, switch to AC units that freeze water during times of excess production (or any time of low electricity price) and use the ice to cool instead of the compressor to cool air during times of low production (high electricity price). Charging of EVs also fits well–plug in the EV, and then it only charges when electricity price dips low enough. Another advantage of this approach is that it stabilizes conventional power plants; fewer plants need to turn off at night, improving utilization and lowering cost.
Here in Tampa/TECO they recently cut the rates due to less coal, NG use for the second time as they build more solar.
Solar also kills the summer A/C power peak cutting the most expensive peak generation saving even more.
A godawful lot of aluminium is used to make roof railings and panel framings , so lets see if we can make aluminium with solar energy instead of buying cheap Chinese aluminium made with coal power.. Solar and wind is able to keep oil producers from gouging oil prices ever since day one and they will continue . Oil producers are all out to crush solar and wind power or at least contain them to single digit percentage market shares.. We are supposed to be installing solar and wind ten or even a hundred times faster by now..Consumers are uncertain about solar and wind simply because of continued low oil prices . Most of us still do not want to touch solar or wind stocks and bonds.. Investors is the biggest enabler of clean energy not the governments.. So far, investors continue to enable and empower fossilheads ..
Yes, true, but maybe light and a tunnel – https://www.cleanenergywire.org/news/thyssenkrupp-tests-use-hydrogen-steel-production-bring-down-emissions
@Greg: It depends on the “system” one installs and how “smart” it is. You say $20k for solar PV and another $15K for energy storage. O.K. $35k sounds good. IF you go with a premium energy storage system that can actually island some selected “critical home circuits”, then you have added “value” to YOU as the system owner. Now you might be looking at almost $30k for a installed smart ESS. I point to the extreme case in California of PG&Es claim of the PSPS (needs) to be invoked for maybe 10 years while the undermaintained grid infrastructure is upgraded to harden the feed points to service areas. Prices are coming down as more players and some well funded players are entering the field. GENERAC a well known generator backup company is in the energy storage business now, of course TESLA, Panasonic, LG Chem, Humless and others are chasing the residential storage dollar.
In 2005, I had a 8.4kWp string wired, grid tied solar PV system install on a home. With all of the rebates at the time, the system was $51k installed. Sold that home, bought another, had a simple string wired grid tied solar PV system of 14.5kWp installed in 2016. This system’s installed costs without rebates or the ITC was right at $51k. Just as a note it was the “soft costs” that jacked up the install price to $51k, it would have been $49k if it wasn’t deemed necessary by the County to have two licensed engineers to sign off on the plans before the construction permit was issued. One civil, one electrical engineer.
Since 2016 the hardware costs have dropped again and panels that used to cost around $0.95/watt are now, even with tariffs can be bought in pallet quantities for $0.75 to $0.80/watt. By next year, the tariffs should be dropping another 5%, panel prices will drop again and one might find larger solar PV systems (overbuild) with smart energy storage in a package would drop to the “justifiable” cost for many. Right now and for the foreseeable future, simple ROI for a solar PV system and or a smart ESS is still a moving target. You can calculate say 15 years for payoff, ‘but’, the true to form electric utilities will cry to the PUC or PSC for electricity rate increases when enough folks get tired of paying more money for using less electricity each month. Every time the utility raises electric rates, the sooner your installed asset pays for itself.