Each year in February, the U.S. Department of Energy’s Energy Information Administration (EIA) puts out final numbers for year-to-date generation as of the end of December, including at the state level, and these measure the rubber meeting the road in terms of the contributions of various sources of generation in powering the United States.
This year saw more gains for wind and solar, which now meet 8.9% of all electric demand in the United States, according to pv magazine’s analysis of the EIA data. Solar generation – both rooftop and utility-scale – grew 25%, and now meets 2.4% of electric demand in the United States.
Wind grew more slowly, with only an 8% increase in raw output, but still supplied 6.5% of all U.S. electricity. When biomass, geothermal and hydro are added in, the United States met nearly 18% of its demand with renewable energy, slightly less than the portion met with nuclear power, which was around 19%.
And while three states continue to meet more than 10% of their in-state demand with solar PV and concentrating solar power, emerging markets saw more of a dramatic change, with 12 states more than doubling their solar output and three states increasing it by 250% or more.
A note on calculations
In the past, we’ve calculated what portion of total in-state electricity generation that solar represents, but this year we decided to do things a differently, and measure what portion of total demand solar is meeting.
These should be the same thing, right? Nationwide they are relatively similar, but state by state things are very different, because some states import a significant portion of their electricity from neighboring states, and other states supply the states around them with power. In particular, we were concerned that by measuring solar output as a portion of generation, we were over-estimating the progress of Massachusetts and Vermont, which import a large portion of their electricity every year.
But while calculating solar as a portion of generation is pretty simple, calculating solar or any form of generation as a portion of demand takes some math and assumptions – namely, around how much electricity is lost between the inverters on solar and wind plants and the end-user. We found that EIA calculated around 9% less sales of electricity to end-use customers than raw kilowatt-hours generated, and we have therefore used 9% for estimated transmission, distribution and other losses for all forms of utility-scale generation.*
For small-scale solar (for EIA this is under 1 MW), we assumed no losses, as the output of rooftop and other small-scale solar installations is typically consumed at or close to where it is generated.
We feel that this will give a more meaningful account of the progress that solar is making in supplying the United States, particularly at the state level.
Leading solar states
California remained the state that both converted the largest amount of sunlight to electricity and met the highest portion of its demand with solar. California’s raw solar generation increased 15% over 2017 levels, and the state now meets 14.1% of demand with solar.
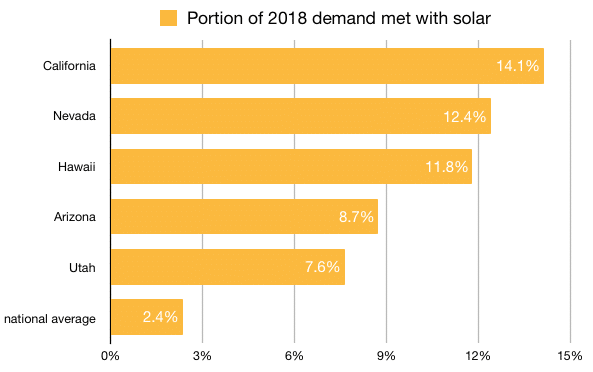
The #2 and #3 states are in the same order as last year, with Nevada and Hawaii meeting 12.4% and 11.8% of in-state demand with solar respectively. No other states reached 10%, although Arizona was relatively close at 8.7%. Utah was next at 7.6%, and all other states examined by pv magazine were below 6%.
And while none made the top 5, some New England states did better than states in other regions, with solar meeting 5.7% of demand in Massachusetts and 4.6% in Vermont. Solar also met 4.8% of demand in North Carolina.
Some states with emerging solar markets saw big increases in output. Solar output increased 457% in Arkansas, 295% in South Carolina, 253% in Mississippi, but as this came from a very small base the contributions to electricity demand remained negligible in these three states.
All told, solar generation increased by at least 100% in 12 states, none of which were major markets a few years ago.
More sun = more solar power
There is an imperfect correlation between states with clean energy mandates and high portions of solar. While Hawaii and California both have 100% zero-carbon and/or renewable energy targets, Vermont, New York and New Jersey also have targets to reach 50% or more renewable energy by 2030 (Vermont has a 75% by 2032 mandate), and they are not in the top 5 for portion of electricity from solar.
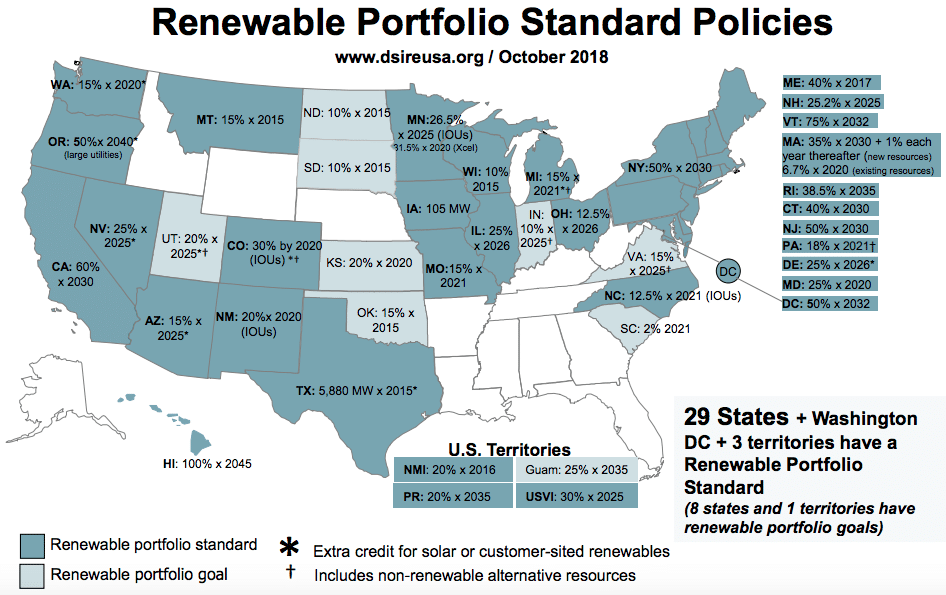
Instead, generally speaking, the places where solar is meeting the highest portion of demand are the places with the most sun, and all of the top 5 states are West of the Rocky Mountains. However there may still be some connection to mandates. While Nevada and Utah don’t have strong renewable portfolio standards, some of the large solar plants built in these two states have power contracts with California utilities and as such are helping to meet the Golden State’s clean energy targets.
All of this begs the question of whether or not wind and solar are expanding fast enough to decarbonize our electricity system in a meaningful timeframe, and that is a more complicated calculation. We will provide a more full analysis of the long-term growth of wind and solar as compared to other resources in a future article. Stay tuned.
*Editor’s note: It is possible that some of the 9% difference between generation and sales to end-customers is exports to Canada and Mexico. However, as it is impossible to disambiguate electrons on the grid, we decided to keep the 9% number as that would spread any exports equally across all forms of large-scale generation.
This content is protected by copyright and may not be reused. If you want to cooperate with us and would like to reuse some of our content, please contact: editors@pv-magazine.com.


Are you talking in the article about demand (e.g. KW) or energy (KWH) served by solar?
The article says demand, but I want to make sure you are using demand as KW and not KWH.
thank you in advance.
No, I am talking about electricity demand in kWh – what you refer to as “energy served by solar”. This wouldn’t make sense as instantaneous demand.
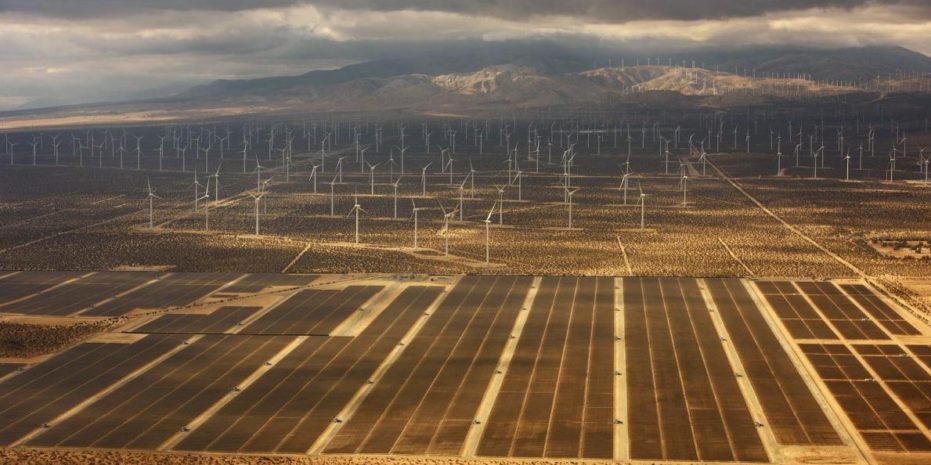
You really need to use a different picture for this article. It shows industrial-scale wind and solar PV but there is nothing green. It looks like a dead zone. It gives the idea that we are destroying ecosystems to produce “clean” energy.
Thanks for your thoughts on this. It’s in the desert, so it isn’t going to be green, but I’m happy to use another photo.