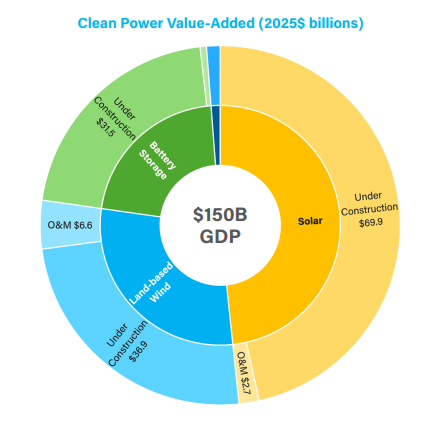
Total economic contributions from the clean power sector surpassed $150 billion last year, according to the American Clean Power Association (ACP) 2025 Annual Market Report.
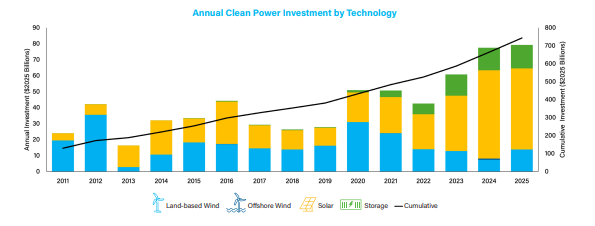
The capital infusion is driven by a maturing development pipeline and a record-breaking year for project commissions, even as certain sectors like utility-scale solar faced localized headwinds.
Operational projects now stand at a cumulative 363 GW. The installed base serves as a revenue gain for rural America, generating approximately $3 billion annually in state and local tax revenue. Clean power developers paid out $3.2 billion in land lease payments in 2025. These payments provide a reliable second stream of income for farmers, ranchers, and other private landowners who often face volatile commodity prices.
Employment figures released in the report show that the sector is a significant driver of the domestic labor market. In 2025, the clean power industry directly employed more than 437,000 Americans. When accounting for the broader economic activity surrounding project development and supply chains, the industry supports more than 1.4 million jobs nationwide.
Clean power positions offer high-quality compensation that exceeds many traditional sectors. Workers directly employed by the clean power industry earned an average of over $78,000 in 2025. This is 15% higher than the national average wage.
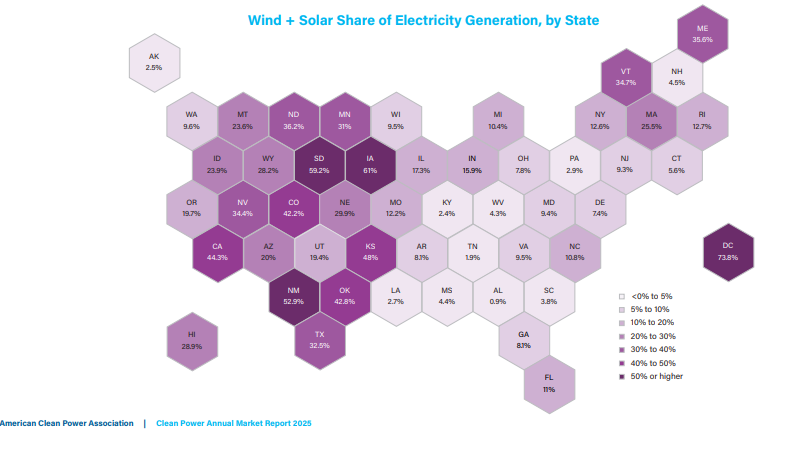
While energy policy is often framed as a partisan issue in Washington, the physical reality of project deployment tells a different story. Clean power projects are now active in all 50 states and 89% of all U.S. congressional districts.
The geographic distribution of these assets leans heavily into Republican-led districts, which host 79% of the nation’s installed clean power capacity. This trend underscores the economic pragmatism of clean energy deployment. States with high wind and solar resources continue to leverage these assets to bolster local tax bases and create industrial hubs regardless of the political leanings of their representatives.
While utility-scale solar remained the largest contributor to the grid, battery storage and land-based wind saw significant momentum that balanced out the slower growth in other sectors. Battery storage had a standout year with 16.2 GW of new capacity commissioned. This represents a 41% increase over 2024 levels.
The surge in storage is essential for grid stability, as it allows operators to manage the intermittency of renewable sources and meet peak demand during evening hours. Land-based wind also posted a strong recovery, adding 6.9 GW throughout the year. This marks a 78% jump from the previous year’s totals, suggesting that the wind sector is moving past the supply chain constraints that hampered growth in 2023 and 2024.
Despite the overall record, utility-scale solar saw a 19% decrease in annual installations compared to 2024.
Industry analysts point to a combination of interconnection delays and temporary trade uncertainties as factors in this dip. However, solar still contributed 27.2 GW to the grid, maintaining its position as the dominant technology in the clean energy mix.
The sector continues to benefit from strong demand from corporate offtakers and utilities seeking to meet aggressive decarbonization targets.
The $150 billion contributed to the U.S. economy in 2025 reflects both capital expenditures on new projects and the ongoing operational costs of the existing 363 GW fleet. Texas led the nation in investment, attracting over $24 billion for new projects. Florida, Arizona, and California also saw significant activity, particularly in the solar and storage segments.
With the development pipeline continuing to grow, the industry is poised to remain the leading source of new generation for the foreseeable future, said the report.
2025 highlights:
- New Capacity Added: 50.3 GW (91% of all new grid additions)
- Total Economic Contribution: $150 Billion
- Direct Employment: 437,000+ Americans
- Industry Average Wage: $78,000 (15% above national average)
- Landowner Payments: $3.2 Billion in lease income
- State and Local Tax Revenue: $3 Billion
- Political Distribution: 79% of capacity located in Republican districts
- Total Operational Fleet: 363 GW (Enough to power 79 million homes)
This content is protected by copyright and may not be reused. If you want to cooperate with us and would like to reuse some of our content, please contact: editors@pv-magazine.com.


By submitting this form you agree to pv magazine using your data for the purposes of publishing your comment.
Your personal data will only be disclosed or otherwise transmitted to third parties for the purposes of spam filtering or if this is necessary for technical maintenance of the website. Any other transfer to third parties will not take place unless this is justified on the basis of applicable data protection regulations or if pv magazine is legally obliged to do so.
You may revoke this consent at any time with effect for the future, in which case your personal data will be deleted immediately. Otherwise, your data will be deleted if pv magazine has processed your request or the purpose of data storage is fulfilled.
Further information on data privacy can be found in our Data Protection Policy.