Historically, one of the main challenges for the ramp up of solar energy was the higher cost of construction relative to other available technologies. Innovation, economies of scale, and incentivization have driven down costs and placed the technology in the center stage as a major component of new builds going forward.
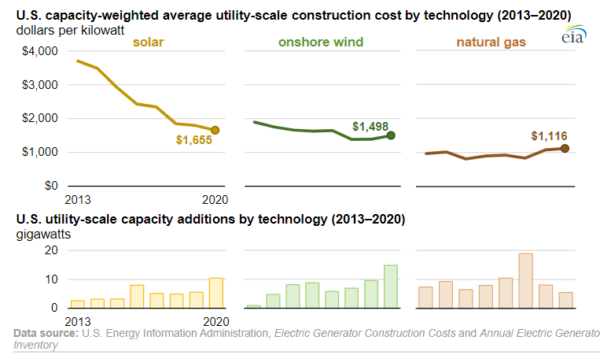
In fact, U.S. construction prices for solar have been cut in half since 2013. The Energy Information Administration (EIA) reports that in 2013, solar project construction costs were nearly $4,000 per kW on average. As of 2020, those costs have fallen to an average of $1,655 per kW for utility-scale developers.
Meanwhile, wind turbine construction costs have remained relatively flat, increasing slightly in recent years. Wind projects averaged less than $2,000 per kW to construct in 2013, and in 2020 averaged $1,498 per kW. Like solar, wind energy is set to have further cost relief from incentives contained within the Inflation Reduction Act of 2022.
Natural gas facilities have also been relatively the same cost to construct over the same time period. In 2013, it was roughly $1,000 per kW to build a natural gas plant, while in 2020 the technology averaged $1,116 per kW.
While natural gas remains cheaper than solar and wind, energy production should pay heed to differences in environmental externalities. This sentiment is increasingly being reflected in utility resource plans and U.S. industrial policy, which contain heavier incentives for renewable, non-emitting resources.
These three technologies—solar, wind, and natural gas—accounted for over 95% of the capacity added to the U.S. electric grid in 2020, said EIA. Investment in new electric generating capacity in 2020 increased by 40% compared with 2019 to $46.3 billion dollars.
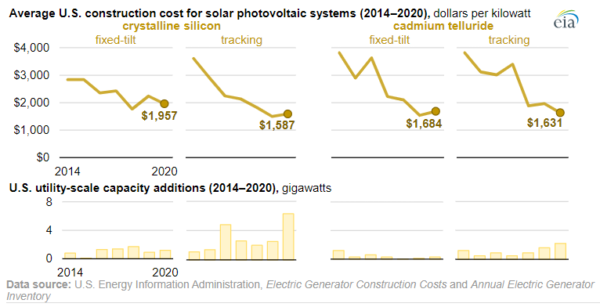
By technology, tracking crystalline silicon utility-scale solar projects had the lowest average construction cost on a per kW basis in 2020. These projects were $1,587 per kW on average, followed by cadmium telluride tracking projects ($1,631), fixed-tilt cadmium telluride projects ($1,684), and fixed-tilt crystalline silicon ($1,957). Note that regional differences in tracker types used may affect the cost per kW. For example, in New England, single-axis trackers support only 8% of active capacity, while 86% of capacity in the Plains region are mounted on single-axis trackers.
While supply chain issues and increased logistics costs have caused a rise in solar project construction costs since 2020, the larger trend is that economies of scale and incentive support will continue to alleviate cost pressures. The American Clean Power Association (ACP) said in its quarterly report that the U.S. may deploy 550 GW of renewable energy by 2030. Solar is expected to lead the charge in this decade of energy transition, representing 59% of active renewable energy projects in queues.
This content is protected by copyright and may not be reused. If you want to cooperate with us and would like to reuse some of our content, please contact: editors@pv-magazine.com.


From the articles I read here, elsewhere and my own experience, prices of solar have risen the last 3 yrs for supply chain , etc issues, especially panels here and cells in China where silicon prices are very high, panel prices are near double 5 yrs ago.
Solar under $.03/kwh is a hard nut to crack, most of those that claimed , failed to deliver, and the future should be in the $.04/kwh range for a healthy industry, all without subsidies.
Especially as higher interest rates drive up costs.