As the nation’s power grid electricity generation project queues continue to grow, its composition is evolving. Solar and batteries are beginning to dominate the nation’s energy future.
The US Department of Energy’s Lawrence Berkeley National Laboratory’s Electricity Markets and Policy group (EMP) has released their annual power grid queue update. The nation’s queue holds over 1 TWac of generation capacity. The new capacity added to the queue this year exceeds 600 GWac and comes from more than 3,000 unique projects.
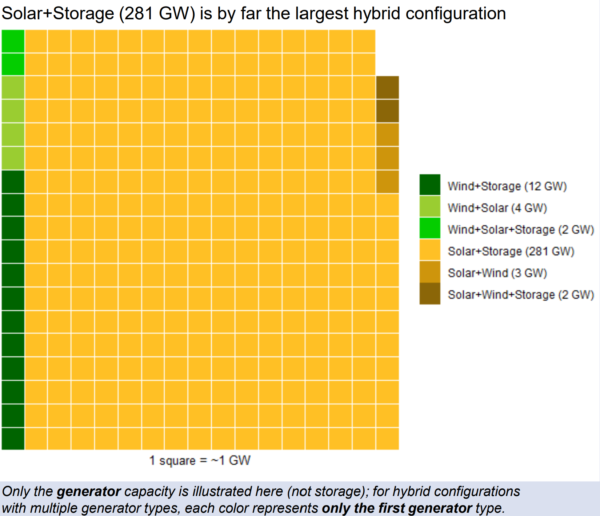
Solar photovoltaics in the queue totals 676 GWac/~845 GWdc of capacity at the end of 2021. 85% of the new capacity came from solar plus energy storage facilities. Solar coupled with energy storage now totals more than 285 GWac of capacity in the queue.
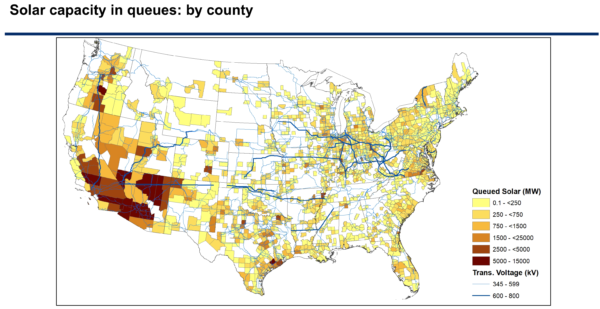
Essentially, the utility scale California solar power market is now a solar-plus-storage market. In total, there is more than 400 GW of energy storage capacity in the queue.
The EMP team notes that the number of hours of energy storage is not available. This author estimates that the average battery has at least two and a half hours of storage capacity, which would put the total hours of capacity beyond one terawatt hour.
80% of the total solar capacity is scheduled to come online before the end of 2024; however, only 13% of all solar projects have a signed interconnection agreement. The report points out that in some markets, interconnection is secured before a project finds an off taker. In these markets, some projects that get approved for interconnection do not get built.
This point is brought home when the full sample is shared and we see that almost three times as many projects are withdrawn than are operational:
- 8,133 “active” projects
- 12,585 “withdrawn” projects
- 3,439 “operational” projects
- 229 “suspended” projects
The completion rate of solar, across all regions, is 16% — lower than the national average.
And if we’re doing analogies, the proof is in PJM’s pudding — the grid management group states that they are overwhelmed with solar power and wind applications, and that they propose to shut down all new interconnection applications for the next two years as they reassess their processes.
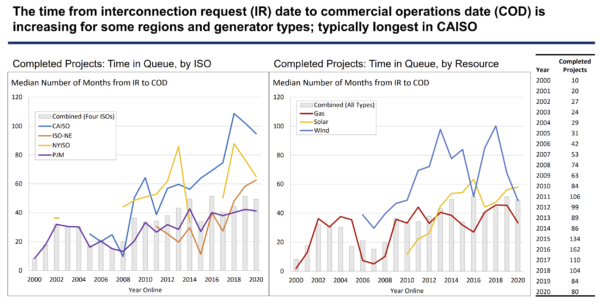
From 2015 through 2021, the report sees that the time it takes to get from from submission, to interconnection, to approval for interconnecting has increased sharply to greater then 3 years — except in Texas’ ERCOT territory.
Among all of these challenges, one statistic shines a light. Last year, pv magazine USA reported that the current queue already meets 85% of the estimated 1.1 TWac of capacity needed to clean our power grid. EMP’s report, released this year, confirms that number.
Additionally, the volume of capacity covered in this document only includes utility scale projects from 85% of national utilities. For instance, the hundreds of megawatts of capacity being deployed in Hawaii, the gigawatts of New York Community distributed solar, and the Massachusetts’ behind the meter market, are not counted.
At a minimum, 6.6 GW of the capacity deployed in 2021 would not have made the list.
This content is protected by copyright and may not be reused. If you want to cooperate with us and would like to reuse some of our content, please contact: editors@pv-magazine.com.

Breaking free from fossil fuels will require a massive amount of lithium batteries…needed for a worldwide demand of EV’s, trains, plains etc.
Utilities: PLEASE don’t lock-up this valuable resource in stationary storage. Plenty of non-lithium (and safer) options are out there…often cheaper and more fire resistant as well.
I agree with you. I used deep cycle marine/RV lead acid batteries on my home and do periodic exchanges since they are much cheaper, and weight is not a problem. Every ICE car has a battery in it that is lead acid and it is already a thriving business. As more lithium batteries come online for cars, more lead acid production could be freed up for homes. Fully recyclable and dirt cheap, lead is already in the loop. lasts bout 6 years before degrading when used in a daily charge/discharge mode of 40% to 50% daily cycle. I have been using them on my home since 2007 and on my third change out cycle. They change out in 5 minutes, and I can do 6 in 30 minutes then swap them out at the store for 6 more. I swap out 12 per year for my 72 batteries that were purchased 6 years before. All batteries eventually have to be swapped out for new ones and lead acid is cheaper overall. They cost $90.00 retail including California State Sales Tax with a turned in battery core (old Battery). About $1,080.00 per year for batteries. 3 power walls, when swapped after 12 years, works out to $21,000.00 plus labor since you cannot do it yourself and that works out to $1,750.00 per year pro rated over 12 years.
Right now the lure of lithium chemistry batteries is that they are readily available off the shelf. More suitable batteries for temporary storage would be ones that are not required to be less weight but have good power density with many cycles. I understand that there ARE are materials and technologies with very promising electrochemistry and though they are backed by good research they don’t have champions with huge financial resources to bring into the market.
Good lead acid has a proven track record and it can work. So can other tested and true chemistries like Nickel Cadmium (I had a string that i got used and proceed to use for another 20 years) Then of course is the venerable Nickel Iron Battery ( also known as the “Edison Battery” that is basically also a “forever battery” that now sits in “licensing rights” purgatory.