
Researchers at Lawrence Berkeley National Laboratory released the latest edition of the annual report, Residential Solar-Adopter Income and Demographic Trends. The report looks at 2.3 million residential solar adopters across the country in 2020, representing 82% of all US systems. The report is intended to serve as a reference for policy makers, industry stakeholders, and researchers.
Key findings
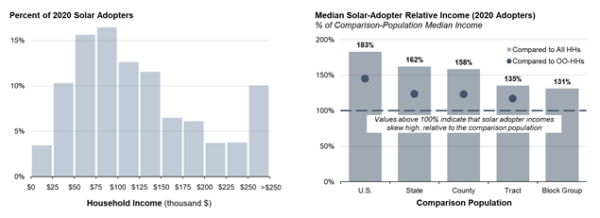
Solar adopters span all income ranges, but generally have a higher-than-average income (Figure 1). Nationally, solar adopters’ median household income was $115,000 in 2020, compared to the US median of $63,000. That disparity is partly related to home ownership, and also to the fact that roughly half of residential solar adopters were in California, a relatively high-income state. Looking at solar adopter income by county, the incomes were 58% higher than the median income of all households in the same county, or 23% higher if comparing only to owner-occupied households (OO-HHs) (Figure 1, right).
Lawrence Berkeley Lab
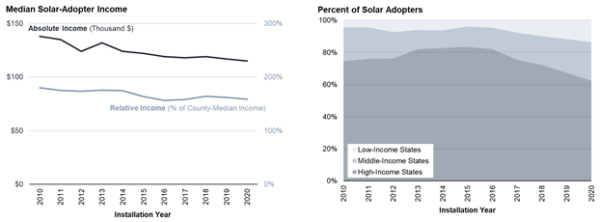
The study showed that the disparity between solar-adopter incomes and the general population has been narrowing over time: Between 2010 and 2020, median solar-adopter incomes in the US fell on an absolute basis from $138k to $115k (see Figure 2, left). The drop reflects the fact that the solar market is deepening, by appealing to less affluent households, and it is broadening into less affluent states. See figure 2, right. which shows an increasing share of the market moving into low- and middle-income states, since 2016.
LBL
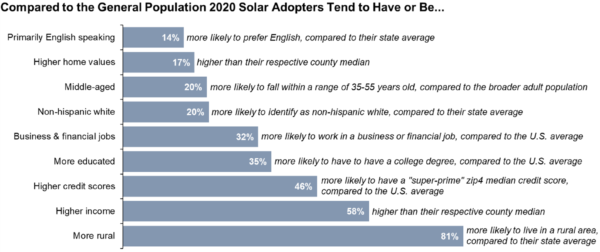
Solar adopters differ from the broader US population in that they tend to be white, middle aged, English speaking, have business or financial jobs, are more educated, have higher credit scores, and be more likely to live in rural areas (see Figure 3). Some of this characterization has to do with the fact that the dominant share of the US residential solar market is in California, and that state’s demographic makeup is different that of other states.
Not surprisingly, the study found that those who go the solar-plus-storage route have consistently higher incomes.
LBL
The report also describes income differences across system ownership models, installers, system sizes, both stand-alone and paired solar-plus-storage systems, and systems on multi- vs. single-family buildings. This latest update includes data on systems installed through 2020.
An online data visualization tool enables users to further explore the data from the report. The authors will host a webinar highlighting key findings from this study on March 17th at 10:00 am Pacific / 1:00 pm Eastern. Register for the webinar here.
This content is protected by copyright and may not be reused. If you want to cooperate with us and would like to reuse some of our content, please contact: editors@pv-magazine.com.


By submitting this form you agree to pv magazine using your data for the purposes of publishing your comment.
Your personal data will only be disclosed or otherwise transmitted to third parties for the purposes of spam filtering or if this is necessary for technical maintenance of the website. Any other transfer to third parties will not take place unless this is justified on the basis of applicable data protection regulations or if pv magazine is legally obliged to do so.
You may revoke this consent at any time with effect for the future, in which case your personal data will be deleted immediately. Otherwise, your data will be deleted if pv magazine has processed your request or the purpose of data storage is fulfilled.
Further information on data privacy can be found in our Data Protection Policy.