How a federal clean energy standard might shape the generation landscape of the Southeast U.S. is the topic explored in a new Southern Alliance for Clean Energy report, Achieving 100 % Clean Electricity in the Southeast.
The report looks at different scenarios that the region’s three major utilities (NextEra, Duke Energy, and Southern Company) plus the Tennessee Valley Authority (TVA) could take to achieve 100% renewable generation against the backdrop of a federal mandate.
The study assumes that any federal Clean Energy Standard (CES) would require TVA to achieve 100% clean electricity by 2030 and the other utilities to follow suit by 2035. The report is also not a least-cost optimization and does not account for most transmission or distribution limitations.
The report also only considers existing technologies that do not emit carbon dioxide, without speculating on future technological improvements; it said these future technologies would only make achieving a CES easier.
Customer-oriented DERs
The first of the two pathways considered focuses on customer-owned distributed energy resources (DERs) that would play a big role in the energy transition.
Under this pathway, the report said that TVA can achieve 100% clean energy with a capacity mix of 10% distributed solar and energy efficiency measures, 41% large-scale solar, 17% wind, 8% other renewable resources, 12% existing nuclear capacity, and 13% energy storage.
Within the scenario, storage is used to meet winter reserve margins, and is not fully used even on peak days. This means that the amount of storage proposed for TVA is there “just in case” of equipment failures or outages during peak events.
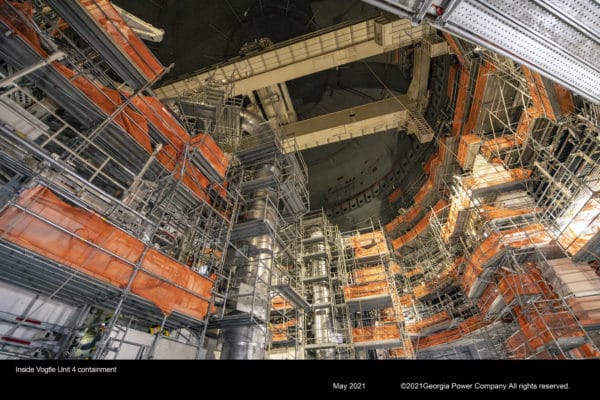
Image: Georgia Power
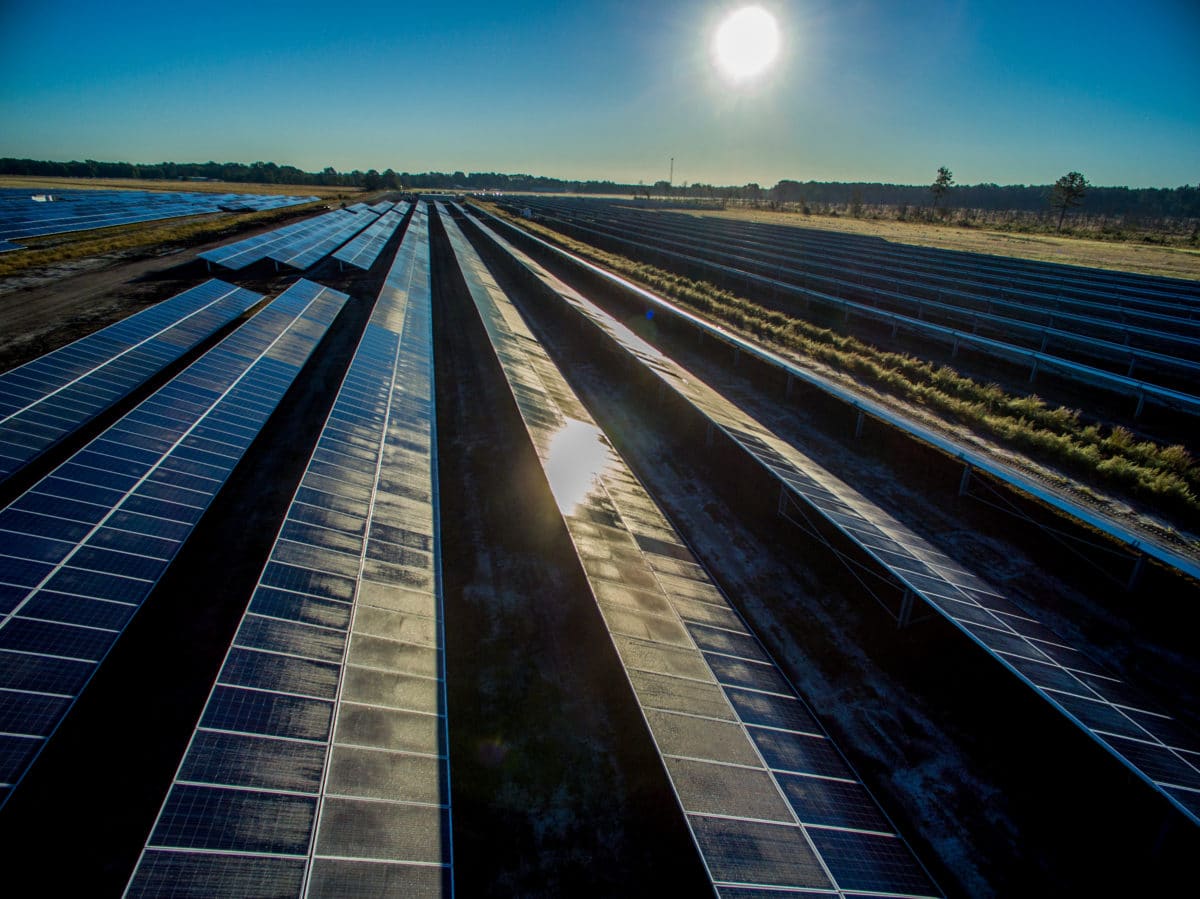
Southern Company’s energy mix is split among its three utilities: Alabama Power, Georgia Power, and Mississippi Power. These utilities are currently fossil-reliant, especially Mississippi Power, which is currently expected to have 90% of its 2035 generation mix be fossil fuels. The customer-oriented pathway would shift each utility’s mix:
- Alabama Power: 12% distributed solar and energy efficiency measures, 37% solar, 21% wind, 7% other renewables, 7% existing nuclear capacity, and 16% energy storage;
- Georgia Power: 16% distributed solar and energy efficiency measures, 38% solar, 16% wind, 5% other renewables, 8% existing nuclear capacity and 17% energy storage;
- Mississippi Power: 7% distributed solar and energy efficiency measures, 42% solar, 34% wind, 3% other renewables, 0% existing nuclear capacity and 14% energy storage.
For these utilities, the resource capacity needs are driven by the winter peak demand shape, though there is relatively little excess generation during peak summer days. The renewables and storage to meet summer and winter peaks are projected to be enough to meet load during a typical spring day, meaning that utilities could likely operate some or all nuclear capacity only in the winter and summer.
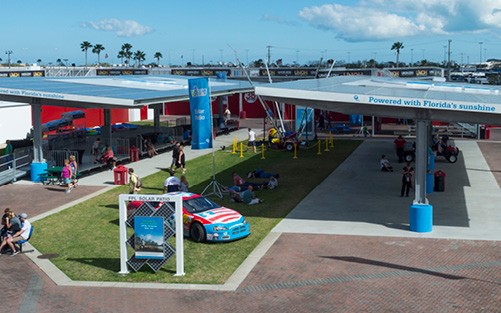
Image: Florida Power & Light
The NextEra plan includes the utility’s plan to integrate Gulf Power into Florida Power and Light by 2022. The resources needed for this scenario are driven by the winter peak, a result of lower solar generation levels in the winter.
The proposed energy mix is 15% distributed solar and energy efficiency measures, 51% solar, 9% wind, 2% other renewables, 6% existing nuclear capacity and 17% energy storage.
This scenario also makes NextEra’s grid less reliant on importing fuel from outside of the state, due to the proposed penetrations of solar and storage.
And, much like Southern Company, Duke Energy’s mix is split among its three utilities: Duke Energy Carolinas, Duke Energy Progress, and Duke Energy Florida. The scenarios for Duke Energy Carolinas and Duke Energy Progress differ from Duke Energy Florida, as the Sunshine State utility does not have nuclear capacity and does not build onshore wind in its territory. The scenario looks like:
- Duke Energy Carolinas: 12% distributed solar and energy efficiency measures, 46% solar, 17% wind, 4% other renewables, 10% existing nuclear capacity and 11% energy storage;
- Duke Energy Progress: 8% distributed solar and energy efficiency measures, 51% solar, 15% wind, 3% other renewables, 7% existing nuclear capacity and 17% energy storage;
- Duke Energy Florida: 9% distributed solar and energy efficiency measures, 55% solar, 6% wind, 3% other renewables, 0% existing nuclear capacity and 27% energy storage.
Because Duke Energy Florida has little wind and no nuclear, solar and storage take a larger role here than in any other scenario explored.
All of these scenarios rely upon a few major mindset shifts for the region, including an immediate and significant commitment to energy efficiency, demand response, and distributed solar, starting in 2022, increased investment in utility-scale solar and storage additions, and some reliance on local wind, which has historically been viewed with low feasibility.
Large-scale renewable reliance
The second major pathway relies more heavily on major capacity additions of large-scale renewables and assumes DER penetration levels are lower than in the DER-focused CES pathways, but still higher than current utility plans.
In this second pathway, TVA can achieve 100% clean energy with a capacity mix of 9% distributed solar and energy efficiency measures, 38% large-scale solar, 22% wind, 8% other renewable resources, 12% existing nuclear capacity and 12% energy storage.
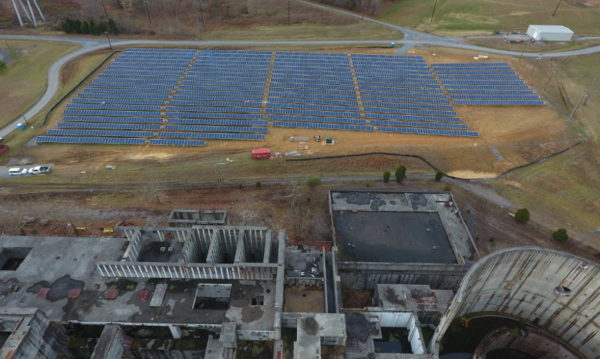
Image: Tennessee Valley Authority
TVA’s existing hydro and nuclear resources help it achieve 100% clean electricity by 2030, even with lower penetrations of DERs, though it is only 1% lower and TVA has not been the most distributed solar-friendly historically. The case would also require a near doubling of the wind developed within the TVA service territory.
As for the three Southern Company subsidiaries, their large-scale mixes put the brunt of capacity on the shoulders of solar and wind, while still maintaining significant DER penetration. Here’s how that plays out:
- Alabama Power: 11% distributed solar and energy efficiency measures, 32% solar, 28% wind, 7% other renewables, 7% existing nuclear capacity, and 15% energy storage;
- Georgia Power: 15% distributed solar and energy efficiency measures, 39% solar, 19% wind, 5% other renewables, 7% existing nuclear capacity and 16% energy storage;
- Mississippi Power: 7% distributed solar and energy efficiency measures, 38% solar, 42% wind, 2% other renewables, 0% existing nuclear capacity and 11% energy storage.
Image: Nextracker
Alabama Power sees the greatest increase in wind and has nearly zero excess generation on its sample peak summer day, meaning that, under this large-scale renewable-focused pathway, both the winter and summer peaks are driving the need for resources. Georgia Power sees a very similar excess generation situation and Mississippi Power is relying very heavily on wind and solar in this scenario.
Once again, with NextEra, the large-scale renewable-focused pathway takes a heavy focus on solar and storage. The utility’s energy mix would thus look like 13% distributed solar and energy efficiency measures, 48% large-scale solar, 17% wind, 2% other renewable resources, 6% existing nuclear capacity and 14% energy storage.
Lastly, the Duke utilities also turn heavily to solar and storage under this large-scale renewable-focused pathway, especially Duke Energy Florida. Here’s the breakdown:
- Duke Energy Carolinas: 11% distributed solar and energy efficiency measures, 47% solar, 19% wind, 2% other renewables, 9% existing nuclear capacity and 12% energy storage;
- Duke Energy Progress: 7% distributed solar and energy efficiency measures, 52% solar, 17% wind, 1% other renewables, 6% existing nuclear capacity and 17% energy storage;
- Duke Energy Florida: 8% distributed solar and energy efficiency measures, 53% solar, 11% wind, 1% other renewables, 0% existing nuclear capacity and 26% energy storage.
Even with a de-emphasis, across all utilities and subsidiaries analyzed in the report, DERs still play a fundamental role in achieving 100% clean electricity with a focus on large-scale renewable resources because any reduction in load or peak from DERs reduces the need for large-scale renewables to be built. The report’s authors held steady in the belief that an aggressive and sustained investment in DERs is important in any pathway to 100% clean electricity.
Scenarios outlined under the second path also rely on getting a lot of large projects on-line quickly, meaning that siting and permitting processes would need to be streamlined as much as possible while still being environmentally responsible.
Some alternative strategies are outlined in the report, but its purpose of publication was to highlight that the region can get to 100% clean electricity using technologies available today. Even so, investment in research and development of new technologies should not be overlooked.
This content is protected by copyright and may not be reused. If you want to cooperate with us and would like to reuse some of our content, please contact: editors@pv-magazine.com.


By submitting this form you agree to pv magazine using your data for the purposes of publishing your comment.
Your personal data will only be disclosed or otherwise transmitted to third parties for the purposes of spam filtering or if this is necessary for technical maintenance of the website. Any other transfer to third parties will not take place unless this is justified on the basis of applicable data protection regulations or if pv magazine is legally obliged to do so.
You may revoke this consent at any time with effect for the future, in which case your personal data will be deleted immediately. Otherwise, your data will be deleted if pv magazine has processed your request or the purpose of data storage is fulfilled.
Further information on data privacy can be found in our Data Protection Policy.