
As work continued to restore electric power across the Electric Reliability Council of Texas (ERCOT) region, data firm Lium released a series of graphs that offer early insight into the state grid’s performance in the days before the blackouts and immediately after.
The Austin, Texas-based firm said that during the power crisis:
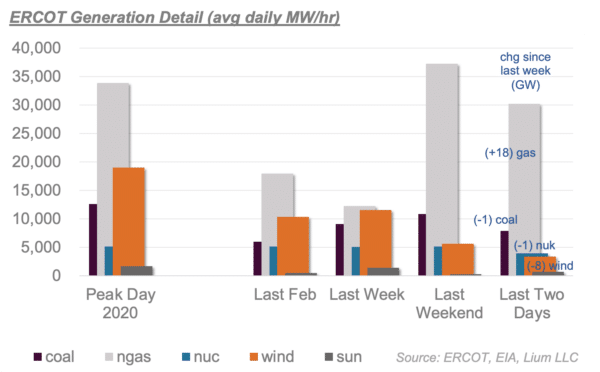
- All power sources disappointed to some degree,
- Wind generation was especially poor, and
- The natural gas ramp was “impressive,” despite shortfalls and a “big crash” in the early hours of Monday, Feb. 15.
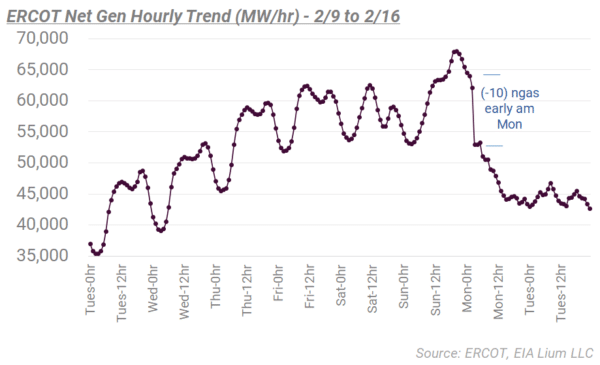
In reporting on the timing of events, the firm said that natural gas power generation suddenly dropped early Monday morning by 10 GW after having tripled capacity to more than 35 GW during the previous seven days.
Coal-fired generation also deteriorated through Monday morning, and nuclear suddenly lost around 1 GW of generation around 7 a.m. Central time.
The firm characterized wind generation as having been “slow” over the Valentine’s Day weekend. Wind production continued to “get worse” through Monday and Tuesday, ending up down around 8 GW compared with the prior week.
It said that in a hypothetical scenario, the ERCOT shortfall could have been met had natural gas, coal, and nuclear all been operating at summer peak levels (+9 GW) and if wind were operating at its typical February rate (+8 GW).
Here are the three graphs as released by Lium:

This content is protected by copyright and may not be reused. If you want to cooperate with us and would like to reuse some of our content, please contact: editors@pv-magazine.com.


By submitting this form you agree to pv magazine using your data for the purposes of publishing your comment.
Your personal data will only be disclosed or otherwise transmitted to third parties for the purposes of spam filtering or if this is necessary for technical maintenance of the website. Any other transfer to third parties will not take place unless this is justified on the basis of applicable data protection regulations or if pv magazine is legally obliged to do so.
You may revoke this consent at any time with effect for the future, in which case your personal data will be deleted immediately. Otherwise, your data will be deleted if pv magazine has processed your request or the purpose of data storage is fulfilled.
Further information on data privacy can be found in our Data Protection Policy.