The United States gets almost 20% of its electricity from nuclear power. The facilities run greater than 90% of the time, with the less than 10% of downtime highly predictable. The almost 100 nuclear facilities have generated the lion’s share of CO2 free electricity in the United States, and – even with the massive growth of wind and solar – today generate nearly 50% of the CO2 free electricity in the country. Nuclear is definitely valuable and important, but this paper’s flaw is not in its fine tuned analysis – but the technology that it ignores.
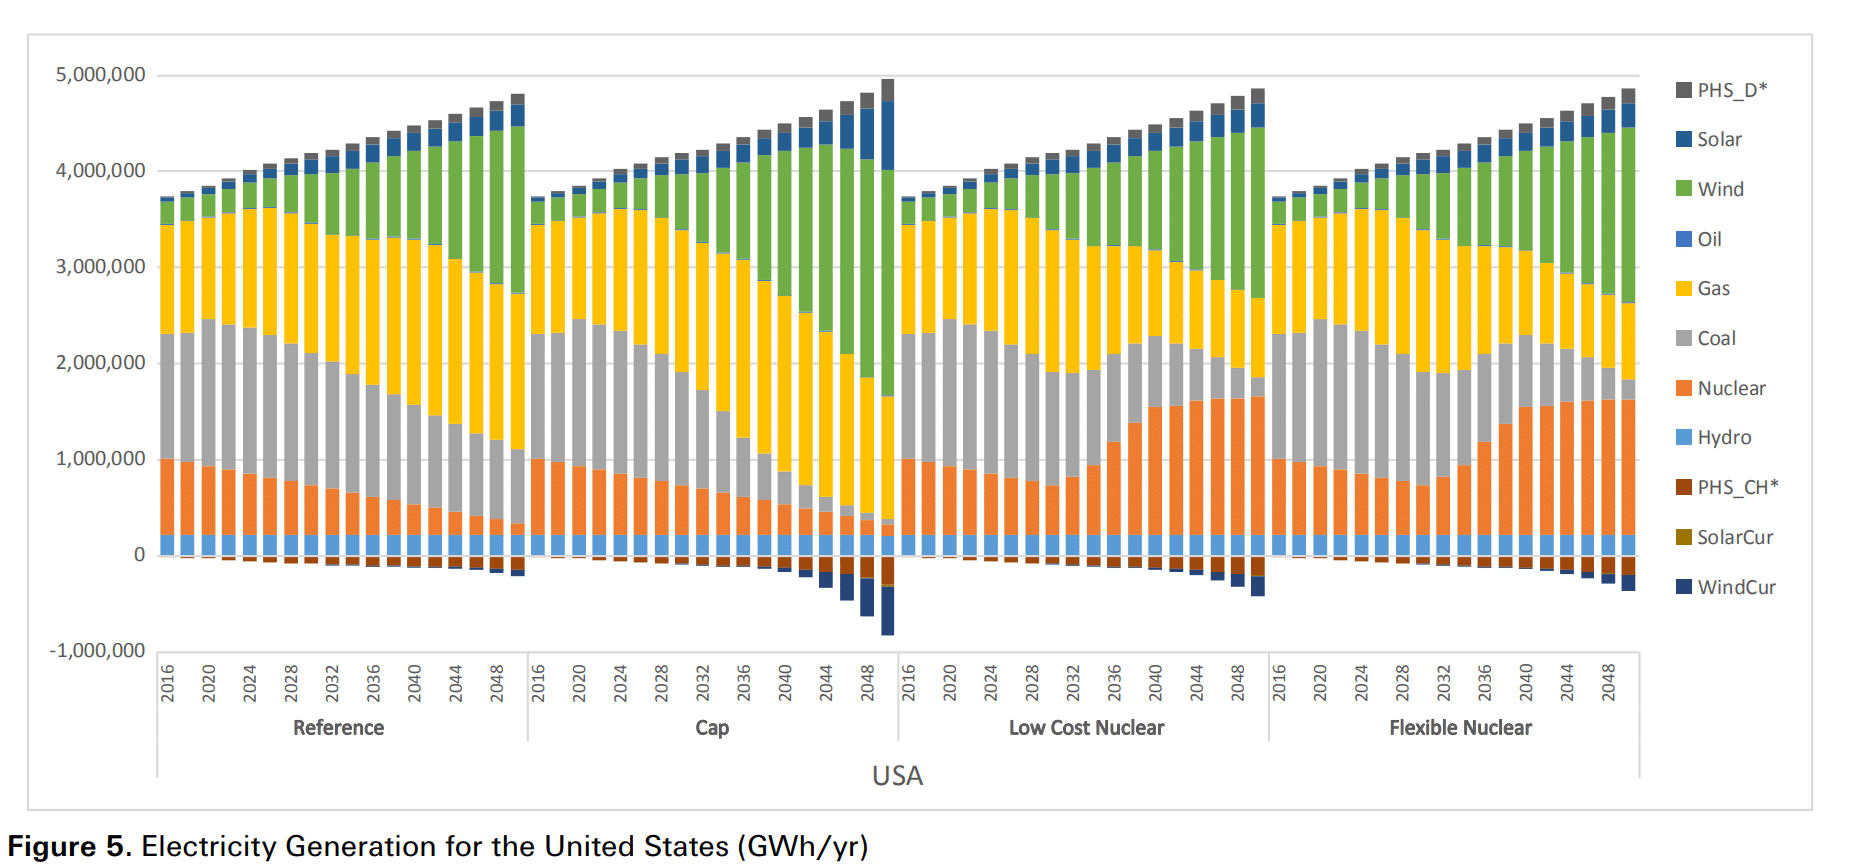
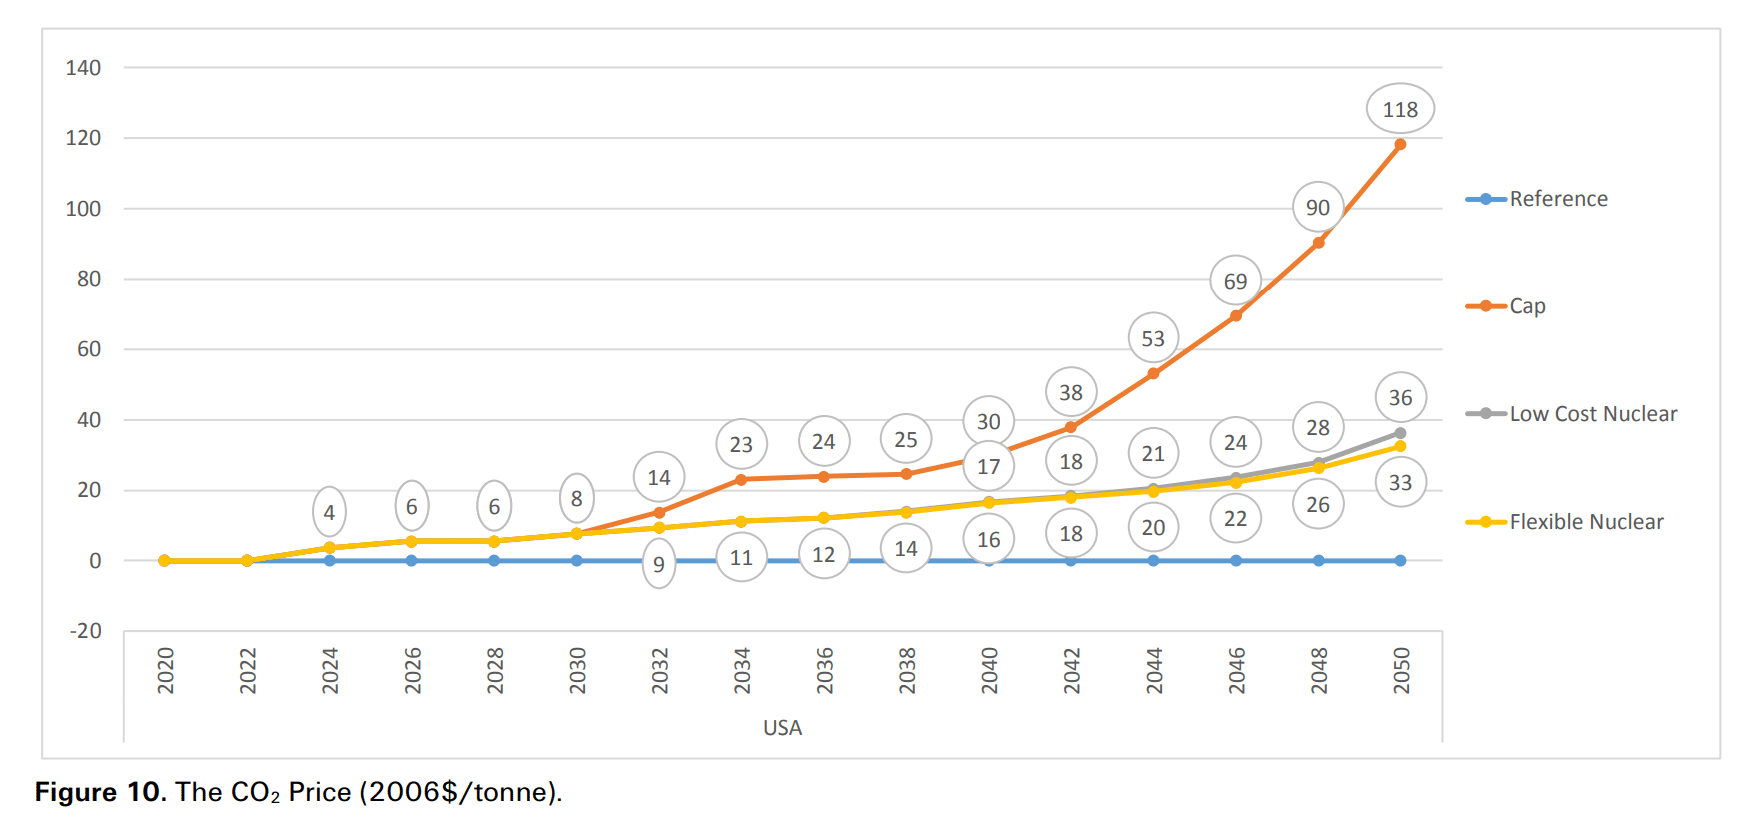
Researchers as part of the MIT Joint Program on the Science and Policy of Global Change have published Deep Decarbonization of the US Electricity Sector: Is there a role for Nuclear Power? The document posits that in the various modeled scenarios below, that as the grid heads toward 90% CO2 reductions, nuclear power being available reduces the equivalent carbon tax from almost $120/ton to less than $40/ton by 2050 (in 2006 numbers). The basis of this is that as wind and solar break 40-45% of annual electricity generation, we’ll then see “curtailments, storage, and back-up capacity add to system costs” (in 2018 numbers).
The research puts the unsubsidized price of solar just under, and wind just above 5¢/kWh, with the subsidized number knocking about a penny per kWh off. Lazard’s LCOE analysis suggests these numbers a bit strong. The paper references the EIA in that advanced nuclear will costs between 7.6 and 8.4¢/kWh. The paper suggests pumped hydro as the energy storage choice available in the future, with no availability of flow/lithium ion type products (maybe they ought check out what Los Angeles just signed).
Note that in the Reference and Cap Scenario above nuclear heads towards almost nothing.
The paper’s crux is the intermittent nature of wind and solar power, and the need for dispatchable electricity sources that can balance out this nature. The logic is fundamentally sound as the power grid is a tool that must be looked at with safety and consistency being objective number one, as life and security is heavily dependent upon it. The chart below shows how the Cap scenario, in which wind and solar head over 60% of generation – before accounting for curtailment, leads toward the highest level of CO2 pricing.
The images shown in this article look at the aggregate model of the nation, whereas the paper shows that there is much greater complexity as they did also model the various mostly independent power grid regions of the nation (beyond the three main grids).
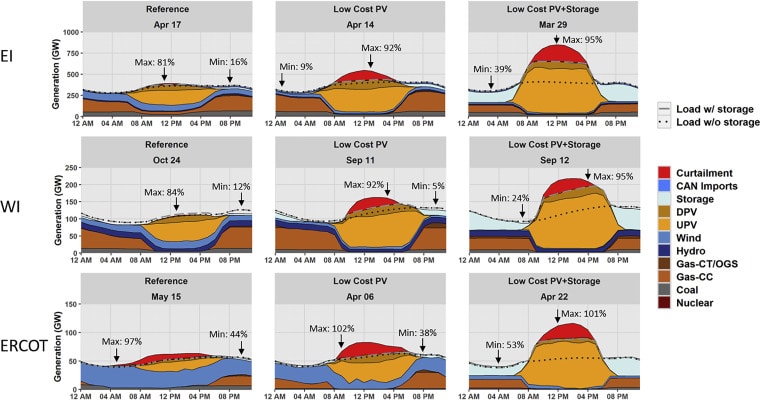
This author suggests that gas as the flexible source is the paper’s flaw. Researchers have the hourly electricity generation potential of wind and solar on the United State’s three unique power grids, and their research suggests that 80% solar+wind, would need about 12 hours – 5.4 TWh worth – of national electricity demand in energy storage. And very recently, NREL has looked at situations where solar power alone is greater than 50% of all electricity, and as you can see in the model below, the light blue of energy storage replaces the gas above quite nicely.
These prior models, and recent research seeing the price of energy storage going down – while volumes heavily expand – suggest that models need consider heavy and long term energy storage utilization. There are those in the business world who feel 24-7 solar might be coming much sooner than many expect, and our modelers need take some heed from those motivated business people.
This content is protected by copyright and may not be reused. If you want to cooperate with us and would like to reuse some of our content, please contact: editors@pv-magazine.com.


Quoted coat of nuclear ignores huge effective subsidy from Price Anderson act
While this is encouraging, you cite research that “suggests that 80% solar+wind, would need about 12 hours … of national electricity demand in energy storage.” That research assumes lossless transmission, and thus ignores loses when large areas would need storage dispatch from afar over long periods (weeks at a time). That research rightly provided the caveat that “policy and planning aimed at providing a reliable electricity supply must therefore rigorously consider constraints associated with the geophysical variability of the solar and wind resource—even over continental scales.” That’s a very simplified analysis. More rigorous analyses are much less optimistic. So I think it’s disingenuous to cite that a mere 12 hours of storage nationally could enable anywhere near 80% RE penetration.
While I like to hope for “quantum leap” advancements in energy storage technology, given the risk of runaway climate change, I would much rather see us invest now in proven near-zero-carbon nuclear power to replace fossil fuel generation. We can then transition away from nuclear as the storage technology matures and is built out over decades. Overall, I think that’s much lower risk for the planet.
The 80% model that involves oversized solar plus wind doesn’t require nationwide transmission. It’s pointed out in the source article, which I wrote as well after I read the original paper and browse the double digit number of models.
I agree with Steve. Nuclear power generation has progressed from the 1970’s so that new reactors use fuel more completely, wastes less, and can be shut down readily. The disasters of the past were using old technology. The Mars explorer has a nuclear reactor powering it. It’s still going. Robert Bryce has written books on energy and his future has natural gas replacing coal for generation, and nuclear replacing natural gas.
And then there is solar thermal base load power, with heat storage. The NREL has estimated there is easily 1,000 GW generating potential, mostly in southwestern states. It already is capable of 24/7 solar power. Thermal storage is not expensive and can store energy for relatively long time periods.
Am I reading this correctly? Seems like an unproven imaginary cost for “advanced” nuclear (no examples extant) is being used while actual decreasing costs for wind and solar are overstated and rapidly decreasing cost of energy storage completely ignored to come up with a plea to consider new nuclear? The same industry that’s had 50 years of subsidies and still can’t build a single plant anywhere near budget or on schedule? MIT, you are losing a lot of credibility here if so. Maybe a revision is in order? Or I missed something? I sure hope so.
“dreams of nuclear”
The myth of safe, sustainable nuclear has been promulgated for decades with promises of new designs and improvements. We can look back to the inception of the nuclear power industry to see the first iteration of this in Lewis Strauss’s comment about nuclear power being “too cheap to meter”. Today we are looking at thirty plus aging, badly designed reactors on the watershed of the Great Lakes, 20% of the surface freshwater on the planet, drinking water for tens of millions of people. This as we face the accelerating climate disaster. Nuclear power during a disaster is a potential disaster in and of itself. Look at Fukushima, look at the Ft. Calhoun nuclear plant in Nebraska during the 2011 floods, how close it came.
It doesn’t take a tsunami to trigger a disaster, take a look at Davis Besse, 2002 to see how close we came to Fukushima on Lake Erie. Thousands of tons of used fuel rods are currently stored at reactors across the country, a debt we saddle future generations with to play hot potato.
We don’t have time to waste with very expensive, slow to build power solutions merely to prop up monopolies. MIT needs to stick to the science, ALL the science, instead of following the money.
I am losing hope that we will ever have national leadership that will make standardized, cost-effective vision power our primary source.
I have moved my current hope to fusion power….but not in support of the terrestrial approach on which so much funding has been squandered over the last 60 years. Consider this approach instead:
https://uploads.disquscdn.com/images/09597b104b84e91f1e31dae27c07cefbb9984224ce373d4fe4c98b503d0669c9.jpg
That’s a good one! Great graphic. Clever too and on point. I completely agree.
Been using that fusion reactor for 15 years, it works well. The entitled elitists of course will claim the sun doesn’t shine at night, the wind doesn’t always blow and fueled generation is the (only) true dispatchable generation resource. Then there’s this ‘thing’ called energy storage and this “other” thing called a PSPS. Makes the notion of dispatchable generation foolish when you’re not “plugged in”. Now because of such a thing as a PSPS folks are looking at their own system with power “most of the time” or power for critical circuits in their homes, reliably with solar PV and energy storage.
Thank you for the reference to the MIT paper! It is rigorous and thorough. I hope everyone gives it full consideration.
The latest Lazard’s storage report has the low-end cost of wholessale storage in high volumes at 16.5¢ per kwh (unsubsidized).
The LA contract that you referenced uses the ITC and probably accelerated depreciation to lower real costs. It also averages very low solar costs with very high storage costs, and these storage costs are for only about a quarter of the total solar production.
I have said before that maybe the U.S. will continue to offer subsidies in this manner because it does not have the political will to enact a carbon tax, but will tolerate renewable/storage subsidies. (Other energy sources get subsidies too.)
However readers feel, I wish there was more transparency in the stories we see about this subject.