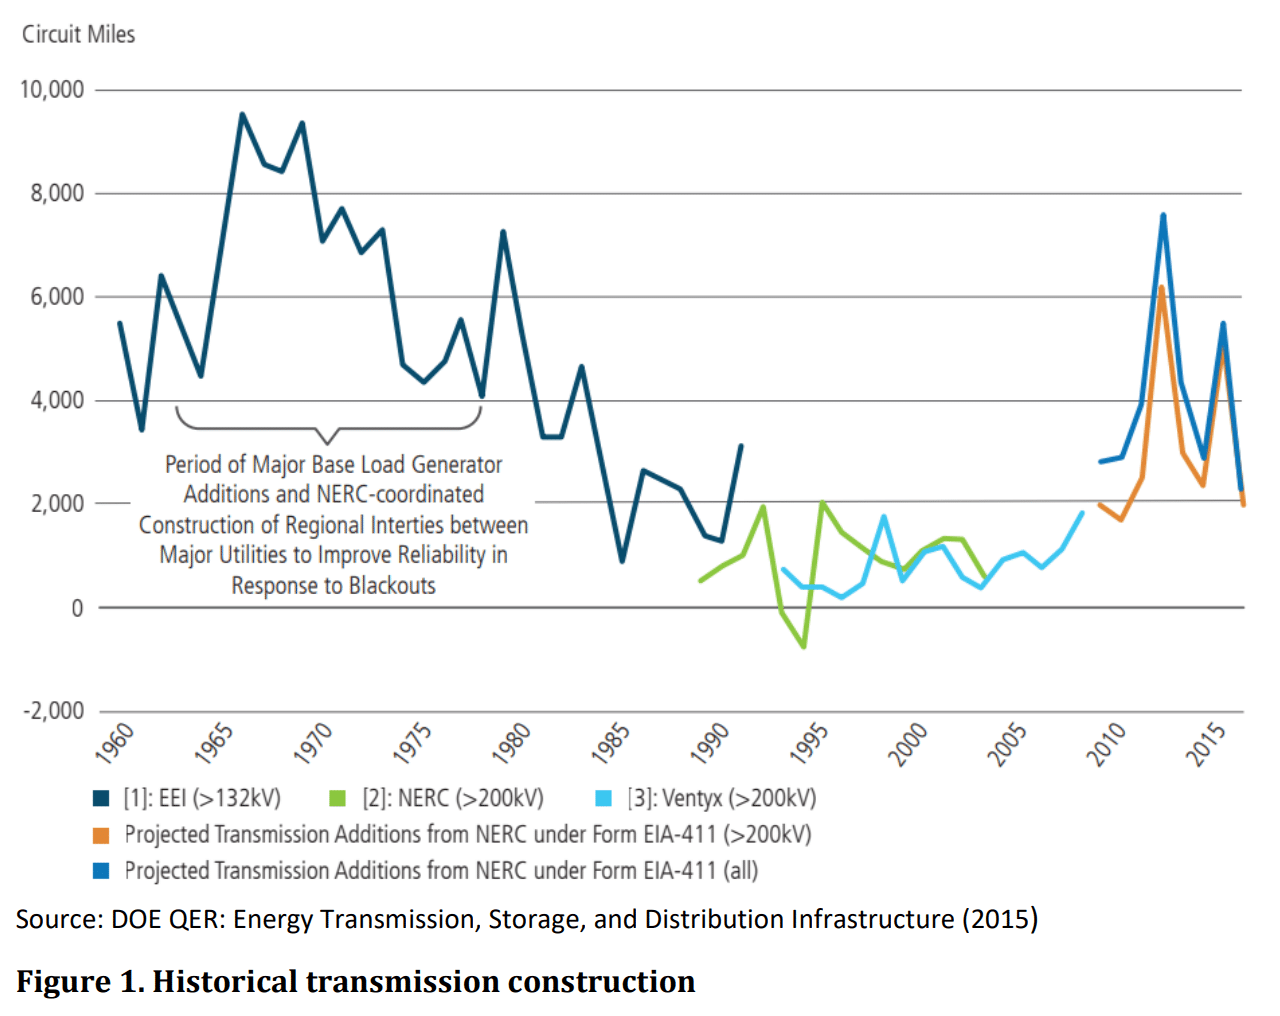
You build utility scale wind and solar where it blows the hardest, and shines the brightest. Then you bring it to the people. The image below, shows historical volumes of transmission built in the United States. Note that from the mid-80s through very recently, this volume has been minimal – including a negative amount around 1995. This is not surprising considering how some people react to power lines, but we may be seeing some thawing – with Florida, the Midwest and Wyoming recently approving large transmission projects.
Researchers at Lawrence Berkeley National Laboratories (LBNL), in Improving estimates of transmission capital costs for utility-scale wind and solar projects to inform renewable energy policy (pdf), modeled the costs of transmission infrastructure needed to move wind and solar, finding the range of average levelized costs for variable renewable energy between 0.1–1¢/kWh. These values can increase the costs of electricity from wind and solar facilities between 3-33%, based on the plants costs of 2.9–5.6¢/kWh for utility-scale wind and 3.6–4.6¢/kWh for utility-scale solar.
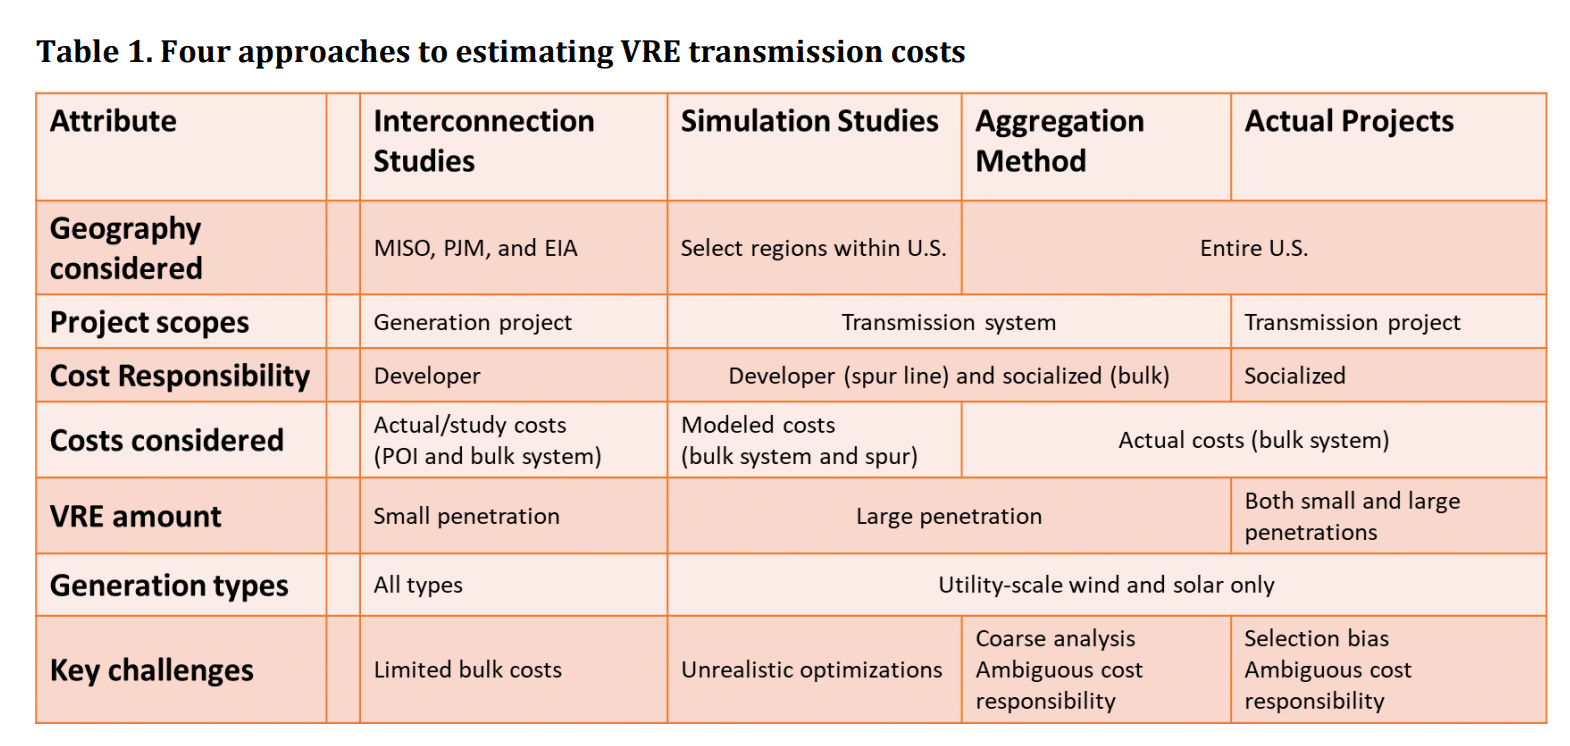
The researchers combined four techniques for evaluating the costs of transmission (below image). The interconnection studies specifically gave the ability to compare non renewable costs to renewable costs, as well actual point of interconnection (POI) costs – however – this type missed out on bulk costs. The other three types of analysis added in the bulk information, while proving other complementary data to fill out the analysis.
With an assumed transmission asset life of 60 years, utilities currently earning close to an 11.25% return on equity on debt interest rates of 3.6%, and a 55/45 debt-to-equity structure, we see a resulting 4.4% real weighted average cost of capital. Prior studies use discount rates as high as 10%, which almost doubles levelized transmission costs.
In the Midcontinent Independent System Operator (MISO) territory costs (lower left image) for wind and, to a lesser degree, solar were notably higher than other forms of electricity – with wind ranging from well below 0.1¢/kWh up to almost 7¢/kWh in proposed systems. However, when moving to PJM ISO (PJM) region (lower right image), we see that solar overtakes wind by a large amount. The red notes the costs for powerlines and moving the power, while the blue covers the costs at the point of interconnection.


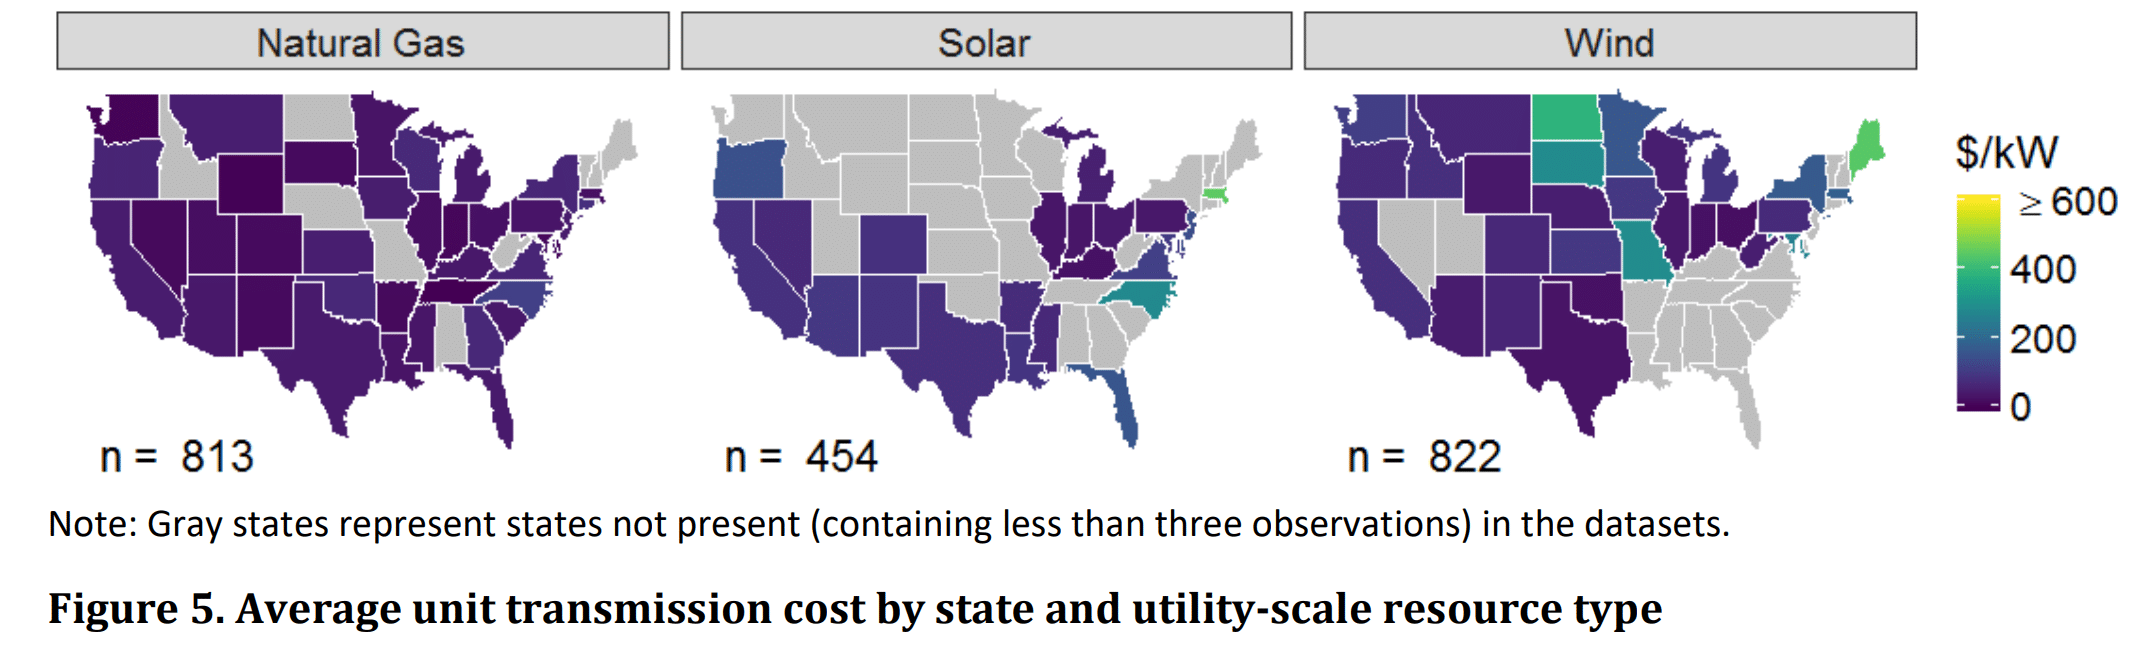
The below image shows a variance across the nation, on a state level. The left map shows that gas interconnection costs are very low, with gas plants taking significantly less land thus able to be deployed where the power lines are. Do note the dearth of solar power data in the upper midwest headed into the northwest, – and big chunks of the southeast. Whereas wind has a big blank spot in the southeast. The higher wind numbers in the Dakotas and Maine suggested to be so due to these areas having to build transmission from scratch, whereas, most others areas had pre-existing infrastructure to interconnect with.
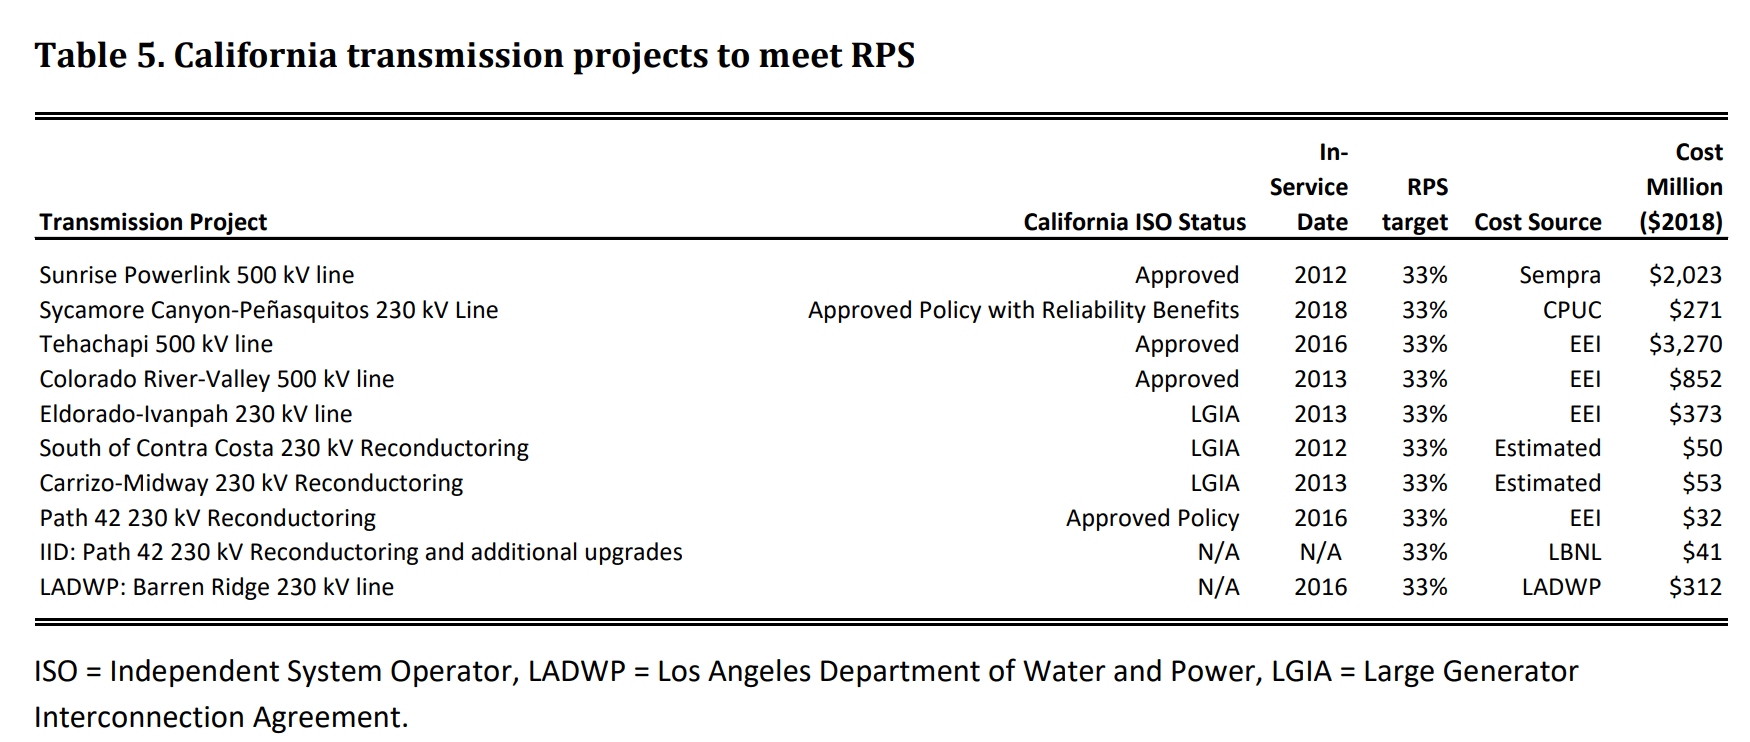
The report looked at specific projects in California, below image, finding that two of the projects – Sunrise Powerlink for utility-scale solar and Tehachapi for wind – represented some of the most expensive interconnection costs in the nation. The Sunrise project was particularly expensive owing to construction constraints. The researchers noted that these two projects, due to the limited number of transmission projects in general, increased the average values significantly, specifically noting that the Sunrise project only represented 6% of the overall electricity transmitted.
Inversely, in Texas, it was noted that there is a single powerline project – the CREZ system – and if this transmission cost is levelized by all the wind on the Electric Reliability Council of Texas system, the LCOT decreases from 0.78¢/kWh to 0.41¢/kWh. With the Texas system significantly expanding to tens of gigawatts of new wind and solar in the coming years, expect this value to go even lower. In fact, many suggest that it is the CREZ system that has allowed Texas to become a global leader in wind, with the same solar potential.
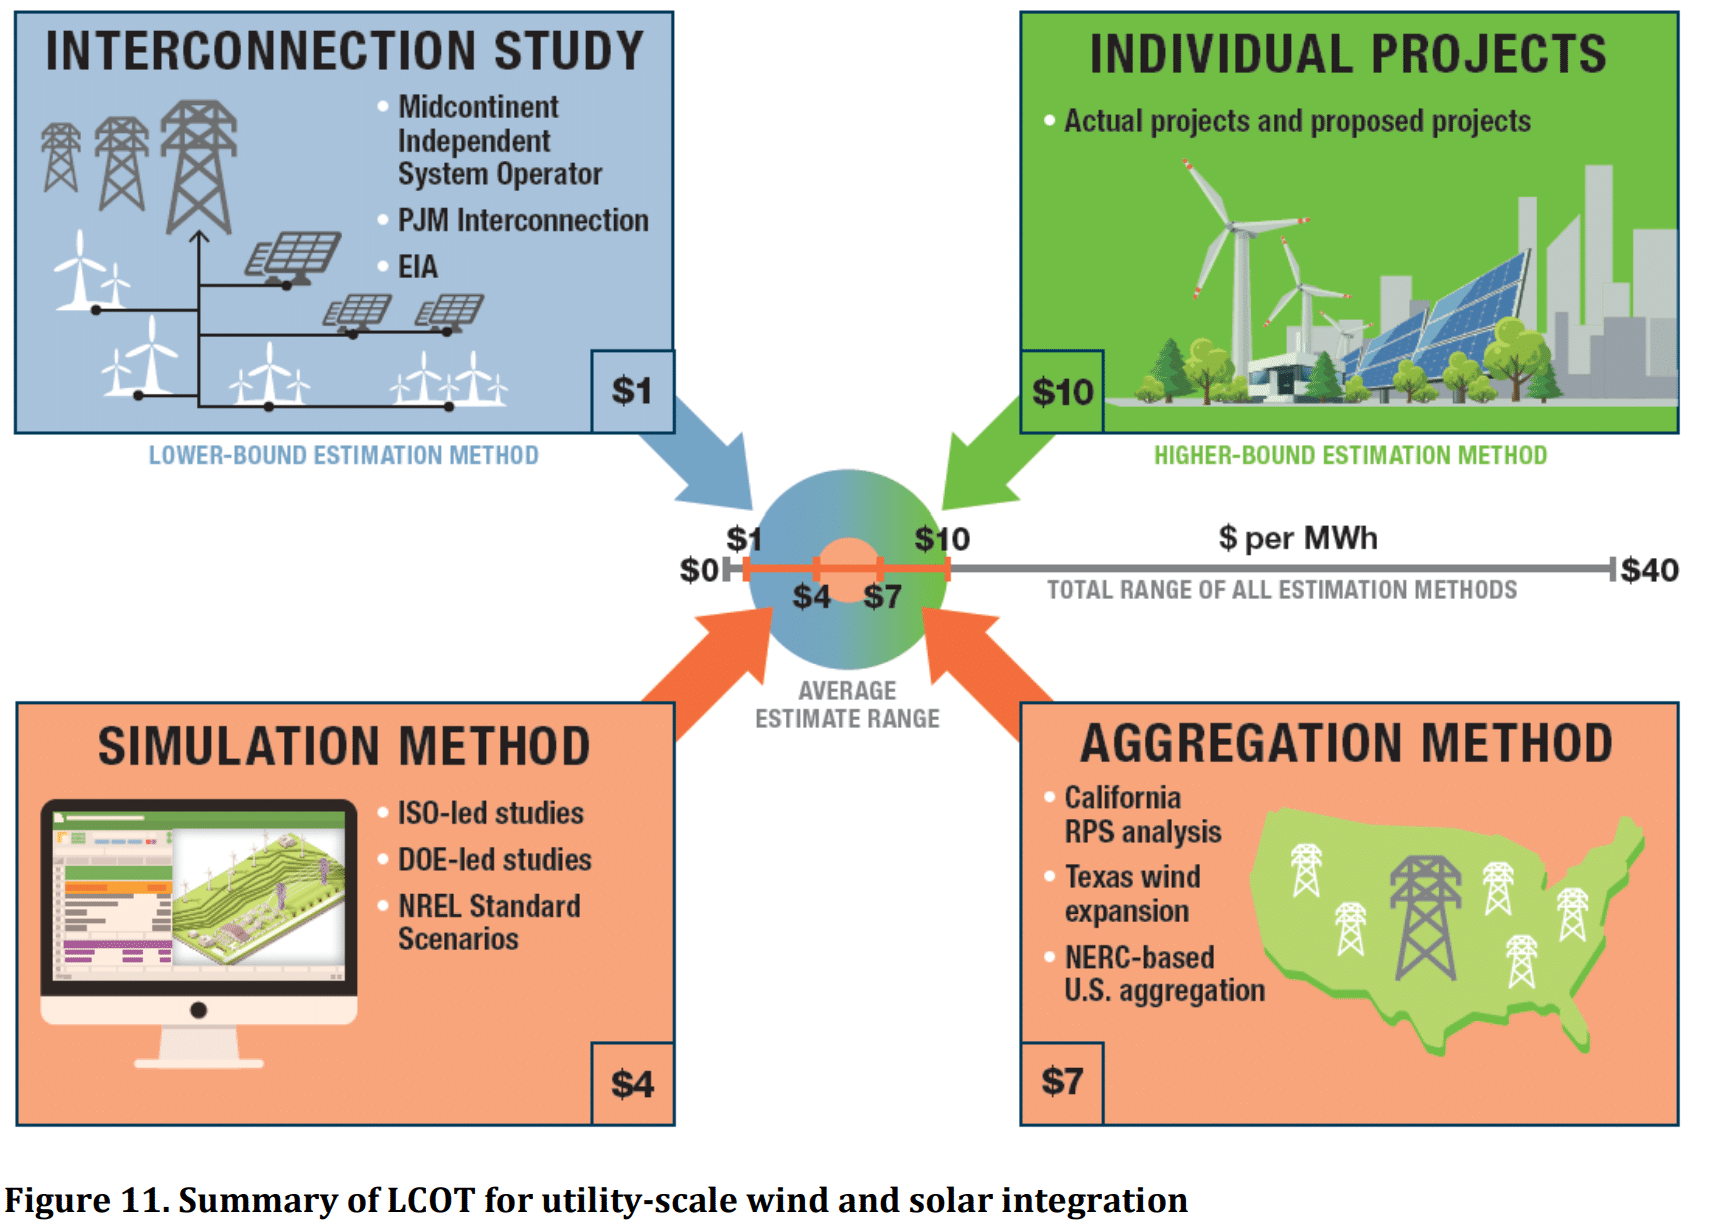
The researchers said the four combined methods, above image, lend confidence to the resulting range of average transmission capital costs. However, this generalized information is not applicable to individual investment decisions as every project in every region has many differences to consider. Rather, it is useful for informing high-level decisions, strategy, and cost-benefit analyses for expanding large-scale renewables.
This content is protected by copyright and may not be reused. If you want to cooperate with us and would like to reuse some of our content, please contact: editors@pv-magazine.com.


CREZ sounds like the precursor of establishing renewable energy power hubs that can be connected to the grid at large or used locally or regionally as the prime power supply for a particular hub. The grid turns into a back bone for the “shuttled” transmission of energy from one hub resource to another hub resource.