The US Department of Energy’s Lawrence Berkeley National Laboratory (LBNL) has released its annual report: Tracking the Sun Pricing and Design Trends for Distributed Photovoltaic Systems in the United States. From a high level, the report sees the median size of systems increasing, higher efficiency modules being used, continued pricing declines – but great variability across all datasets.
For the purpose of this report, large non-residential is defined as greater than 100 kWdc, and less than 5 MWdc – if ground mounted. Small non-residential is less than 100 kWdc, and residential is single family – and depending on the data provider – might include multi-family. All system sizes are in DC wattage. And, while not officially released – the slide deck can be found here (pdf), and the full report here (pdf). Edit – since the documents have seemingly been removed, here they are hosted on pv magazine USA – slide deck (pdf) and full report (pdf).
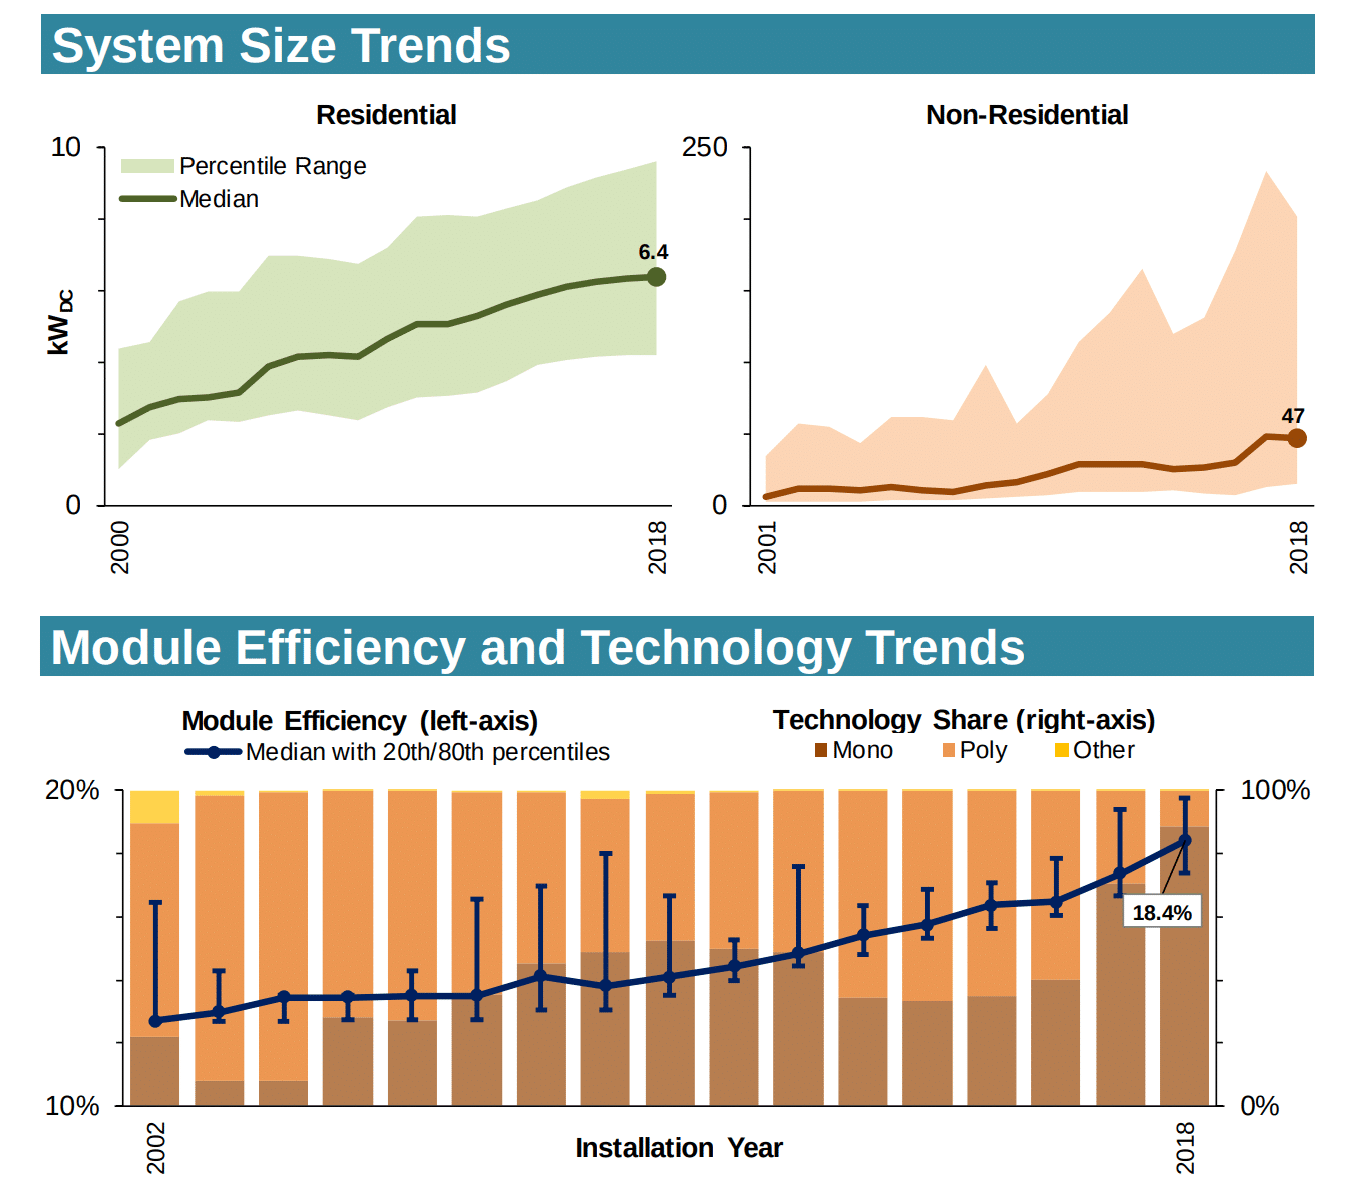
The report notes how module efficiencies have increased from 12.7% in 2002 to 18.4% in 2018 (bottom image of above graphic), which is a 45% increase in median efficiency. The lower half of the efficiency graph shows how solar modules have heavily shifted from being 20% monocrystalline to almost 90% mono. Concurrently with this, we see that residential solar systems, during a slightly longer period, have increased in size from 2.4 kW to 6.4 kW – which is a 167% increase in median size. For non-residential systems – the system size increase has been even greater, with much of that expansion happening in recent years.
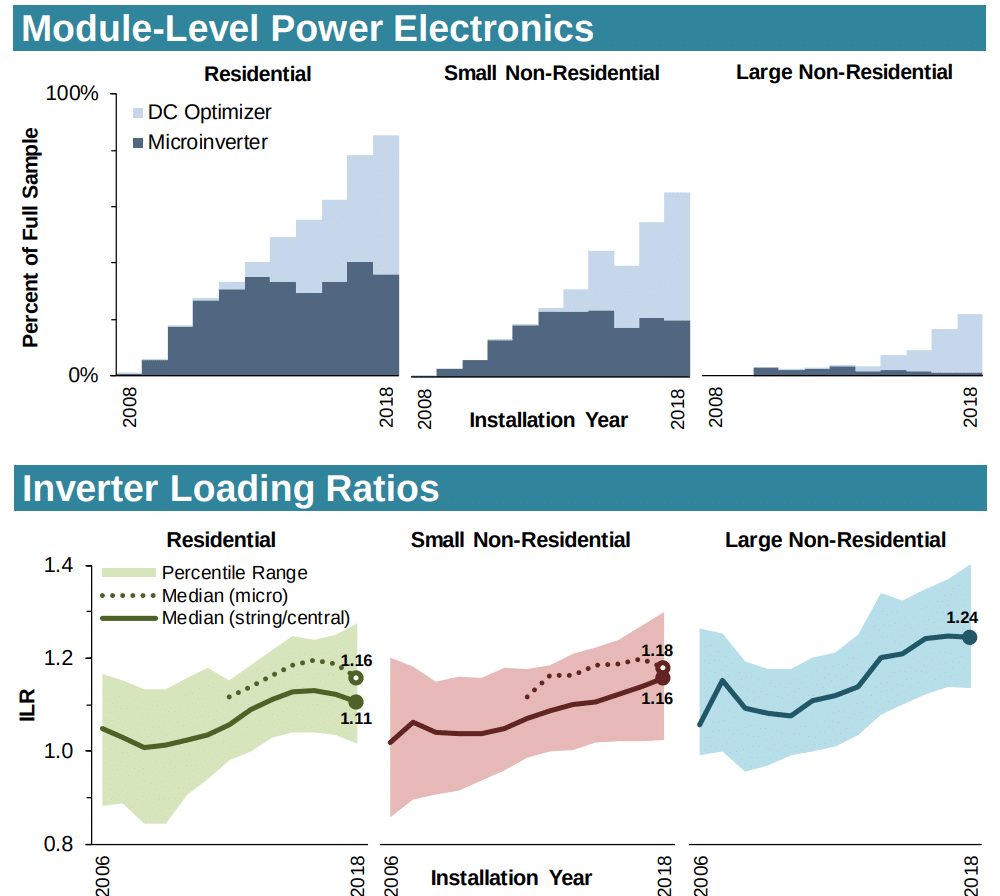
The below graphic shows how microinverters and DC to DC optimizers have come to dominate the residential market, and are taking a larger share of the small non-residential market. Expect this trend to continue for rooftop systems as the most recent National Electric Code, requiring module level automatic shutdown, is slowly implemented nationwide.
The report also suggests that the increasing inverter load ratios have increased partially because solar module pricing is falling, making oversized DC to AC ratios economically attractive.
We’re also adjusting the angle that we face our solar modules. LBNL notes that in 2005, 80% of systems faced south – whereas in 2018 – only 57% of systems faced south, with 23% facing west and the majority of the remainder facing east (as well, a small portion facing north). This is most likely happening for two reasons – first is that the lower efficiencies of facing away from the south are acceptable with the significantly lower pricing, as well, since the report is heavily dominated by California (still the biggest kid on the playground by far), time of use charges for solar adopters is changing the financial modeling significantly.
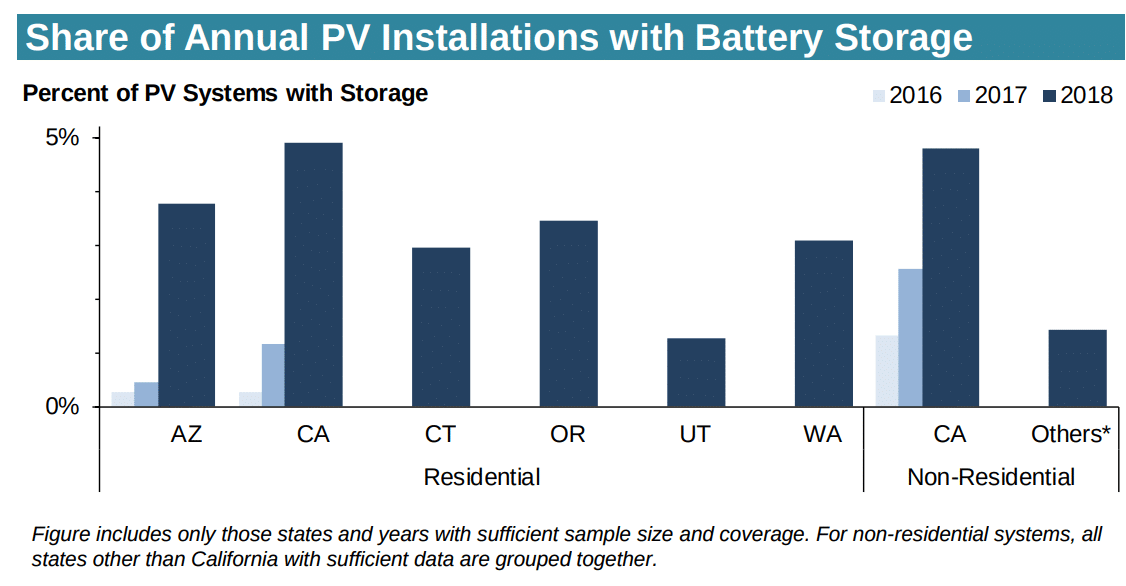
Of course, solar plus storage is increasing (below image) – but truly still only in very limited markets to considerable percentages. The ranges of systems with storage are from 1-5% in 2018, however percentages in some utility jurisdictions (e.g., 20% for Salt River Project in Arizona) are higher. And 60% of PV permits issued in 2018 on the Hawaiian island of Oahu included storage.
And now – for the pricing data.
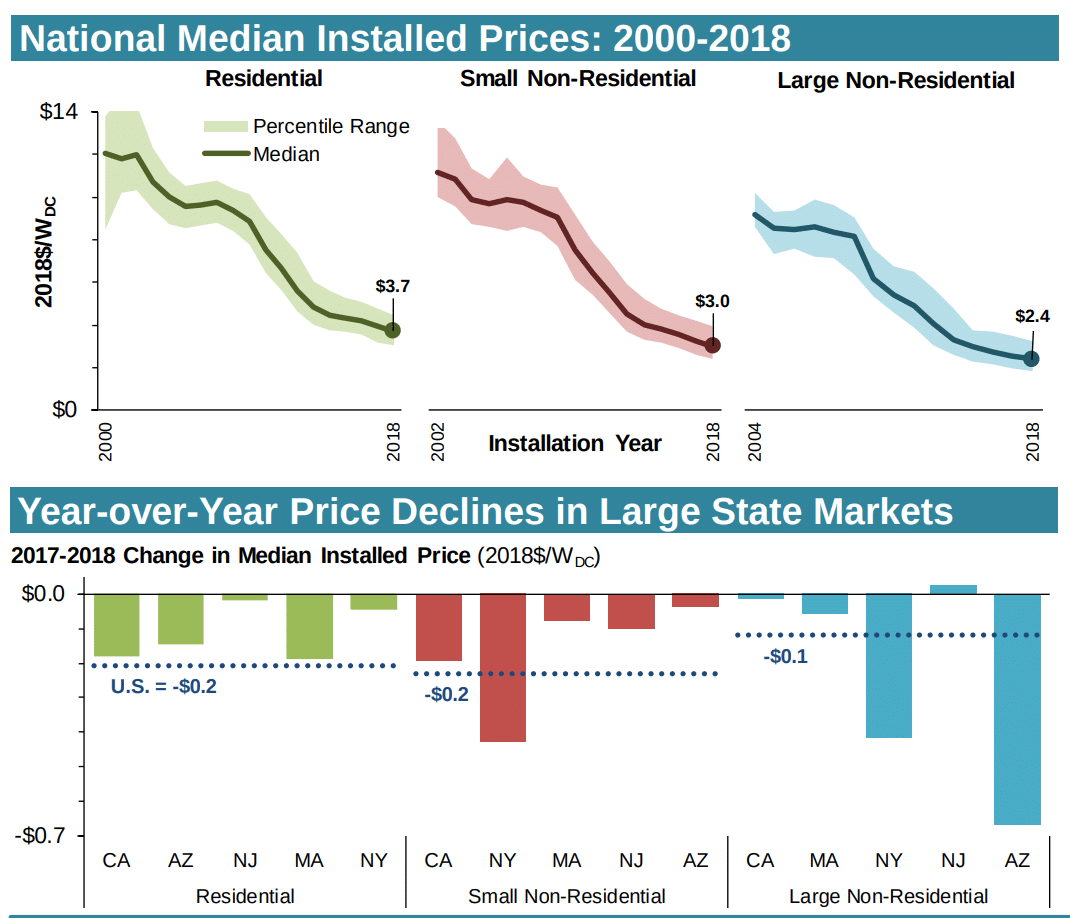
LBNL notes that long-term annual price declines over the full analysis timeframe have averaged roughly 50¢/W per year, however, over the last year of the analysis period (2017-2018), median prices fell by 20¢/W (5%) for residential, 20¢/W (7%) for small non-residential, and 10¢/W (5%) for large non-residential systems. These price declines are consistent with the pace since 2014, which is slower than the years prior.
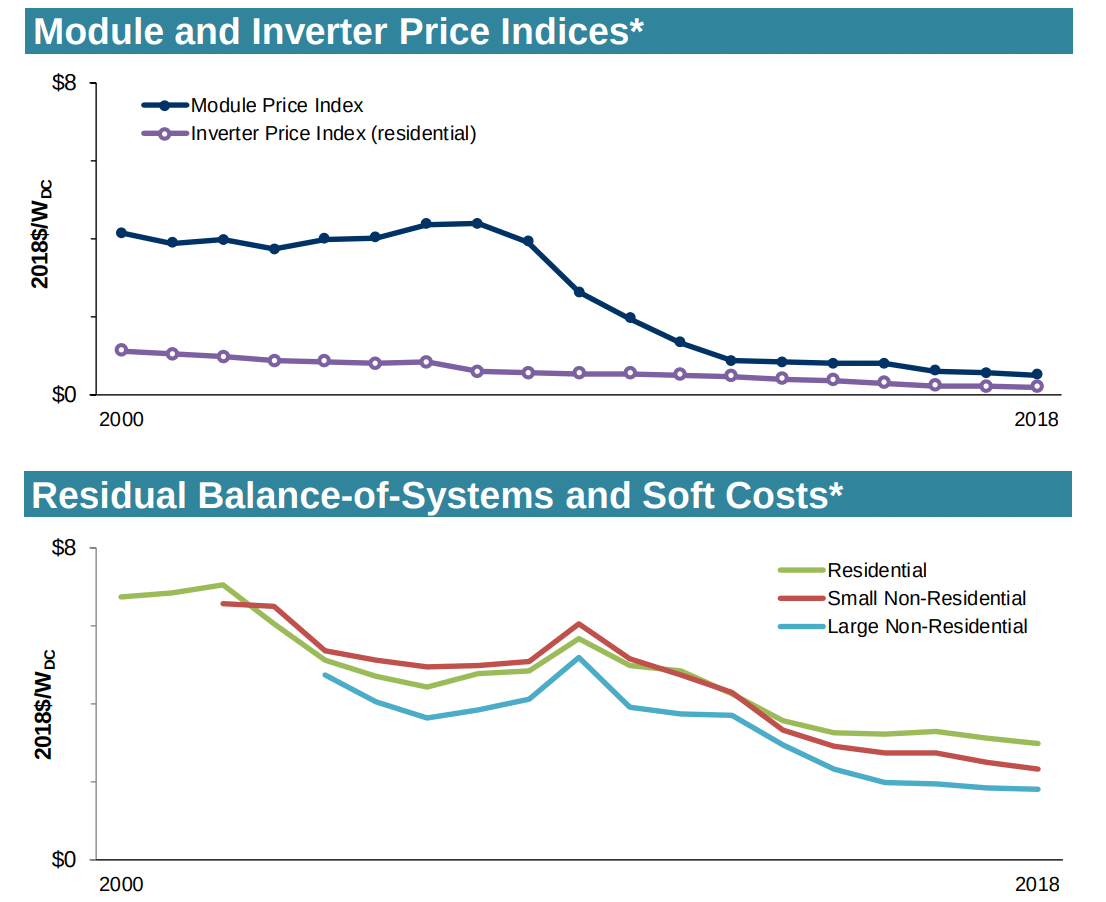
The pricing dynamics of 2018 into the first half of 2019 are a bit different though. Relative to the first half of 2018, median installed prices for the first half of 2019 fell by 10¢/W for both the residential and small non-residential segments, however, median prices for small non-residential systems instead rose slightly. Since 2014 – when module price declines tapered off (below image), 36% of the total drop in residential prices is associated with modules, 28% with inverters, and 36% with balance of system+soft costs, while in non-residential systems, a slightly higher percentage (55%) of recent price drop due to balance of system+soft costs.
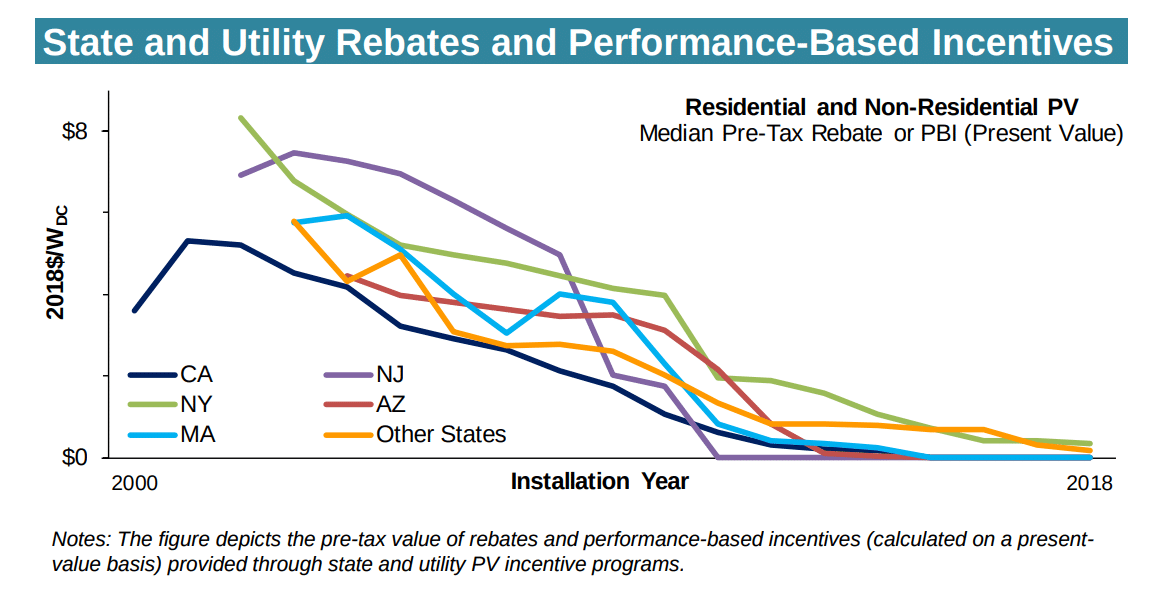
And a great piece of data for the sales professionals to show customers asking whether they should buy now, or wait until pricing falls further: When focusing on direct cash incentives provided in the form of rebates and performance based incentives (PBI), we saw at their peak, many programs were offering incentives of $4-8/W, but now, many have been largely phased-out, or have diminished to below 50¢/W (below image). The report suggests, “Long-term drop in rebates and PBIs equates to 66% to 100% of the installed price decline among larger state markets.”
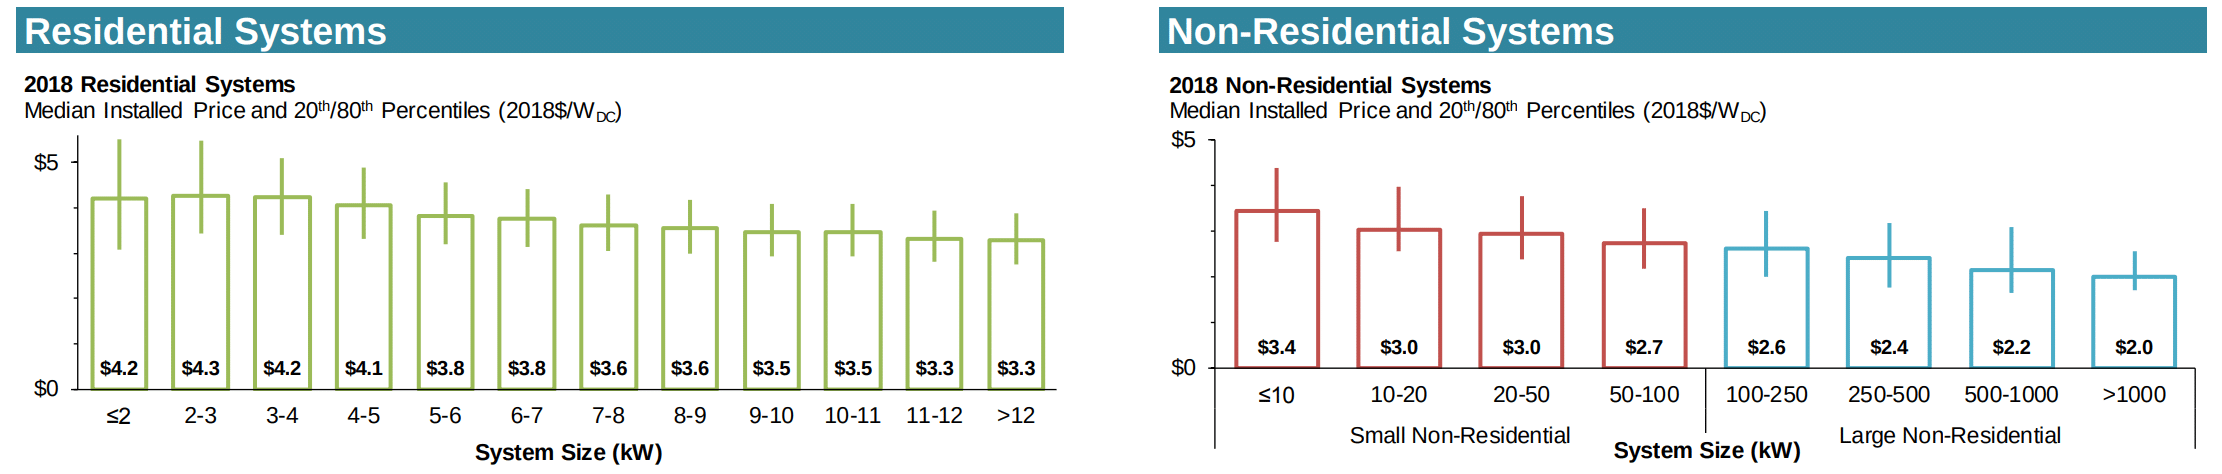
Scale still matters – but only to a point. Among residential systems installed in 2018, median prices were roughly $1/W lower for the largest (>12 kW)
systems compared to the smallest (≤2 kW) systems. Among non-residential systems, which span an even wider size range, median prices were $1.4/W lower for systems >1,000 kW, compared to the smallest non-residential systems ≤10 kW (keeping in mind that ground mounted systems in this report are capped at 5 MWac). As the system sizes increase, the fall in pricing decreases.
There’s also a significant difference in pricing on many levels. For instance, below we see state level variance. The report suggests market size, competition, incentive levels, permitting and interconnection processes, and labor costs all dance together to create this variance. Interestingly, most states’ median prices are below the national median, with some of the largest markets (CA, MA, NY) being relatively high-priced, pulling overall U.S. median prices upward.
It’s more complex than that though, as the report notes that later regression analysis shows that larger markets, in fact, do tend to have lower prices, but other factors counteract that effect in the figures above.
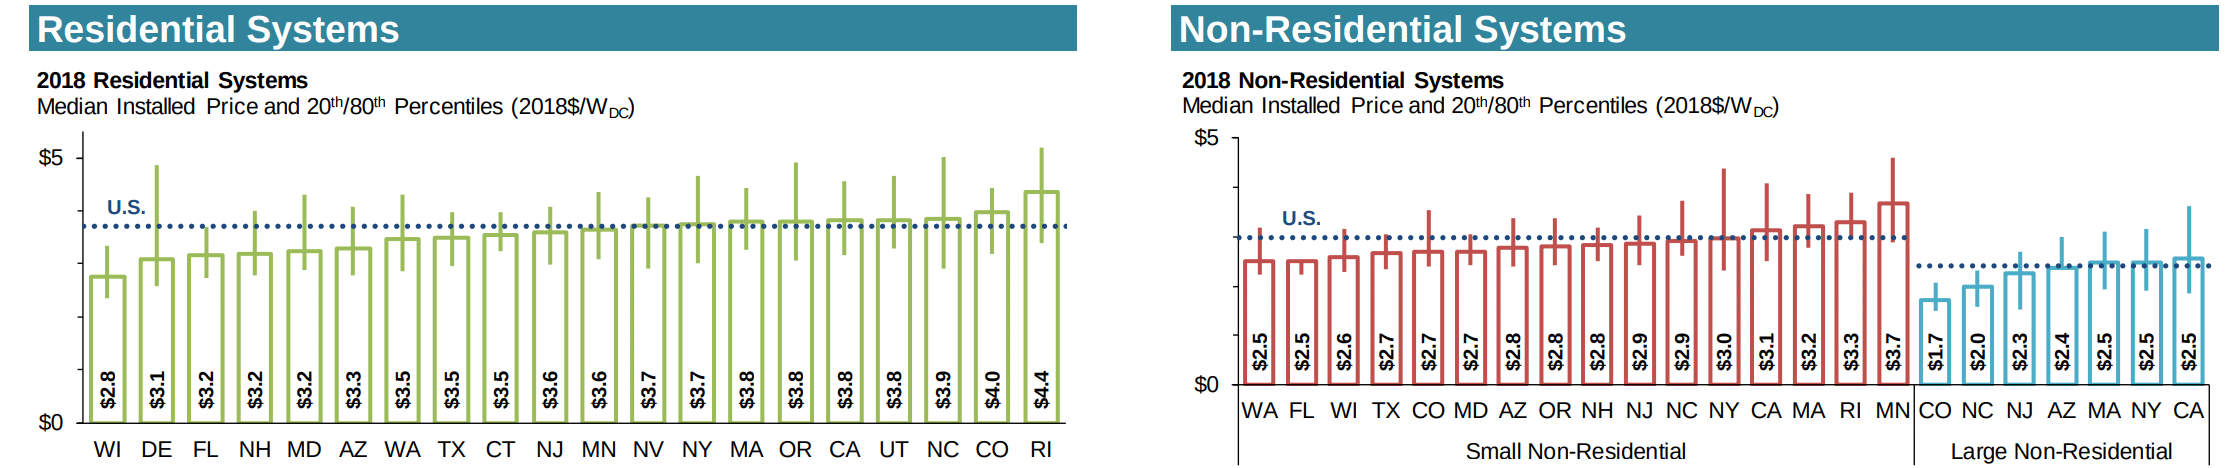
Great variances can be seen in all system sizes,with the middle 60% of systems installed in 2018 showing, $3.10/W to $4.50/W for residential, $2.40/W – $4.00/W for small non-residential, and $1.8/W – $3.3/W large non-residential. Some of these variances can be seen in markedly higher pricing for systems with module efficiencies >20%. Median prices differ by 40¢-90¢/W between systems with efficiencies above or below 20%, depending on customer segment. For residential systems, median prices for systems with microinverters were roughly 30¢/W higher, while those with DC optimizers were roughly 10¢/W higher, compared to systems with no module level power electronics.
Overall, what we might be able to ascertain is that our market is growing larger, and wider. The sizes of systems being installed, the markets we’re installing in, the products we can offer, and nuances with which we’re installing these systems are all driving greater variability.
Edit: 09/21, 10.02 AM PST – added links to documents hosted on pv magazine USA.
This content is protected by copyright and may not be reused. If you want to cooperate with us and would like to reuse some of our content, please contact: editors@pv-magazine.com.


I installed my 7kw array. I used solar edge and optimizers. Sunpower used 327w commercial panels, ironridge mounting. 21 panels, cost of everything DIY was $5400 or 80 cents a watt. I couldn’t afford doing the BS rebates and tax credits as it would have cost me $21000 for my system. These prices are nonsense. Why not get rid of all rebates, tax credits and let people put up panels, get them inspected by electricians and be done. I will increase my panels to about 18kw so I can charge my Model & and install a 60kw battery system that will power my house for 3 days with no input. There is so much sludge in getting solar panels installed it is like the rules were developed by Big Oil. I could have bought new panels for $1000 more but liked the 60v sunpower.
Get rid of government out of the equation and the prices will drop to at most $2 per watt.
In 9 months my panels have generated 7mwh of power. Here in texas it is only about 12 cents a watt but still my payback will be less than 4 years. Remember, power is payed with after tax dollars so the amount you save on power is 20 to 30% more as you simply don’t have the expense.
good rick. You still can collect the 30% fed tax credit. DIY