The share of solar in the country’s overall electricity mix continues to rise, as revealed by the latest statistics from the U.S. Department of Energy’s Energy Information Administration (EIA).
We crunched the numbers from EIA’s recently released Electric Power Monthly report covering June 2019, and found that solar represented 2.7% of all electricity generation in the United States during the first half of 2019, up from 2.4% in the first half of 2018.
According to EIA, the output of the nation’s rooftop and large-scale solar plants rose only 9% over this period, however electricity use as measured by sales to end-customers fell 1.9%.
As there are limited imports and exports from the United States to other nations (net imports from Canada met around 1% of demand last year), solar also met 2.7% of all electric demand. Wind met 7.7% of electric demand during the first half of the year, meaning that wind and solar together met 10.4% of the nation’s electric demand.
It remains to be seen if solar and wind represent more than 10% of power for the whole year, given both increases in electricity use driven by air conditioning in July and August and seasonal patterns of wind output.
The West leads by a wide margin
As always, some states had much higher portions than others. In-state solar met 17.4% of California’s electric demand in the first half of 2019, cementing its position as the leading state for integration of higher levels of solar.
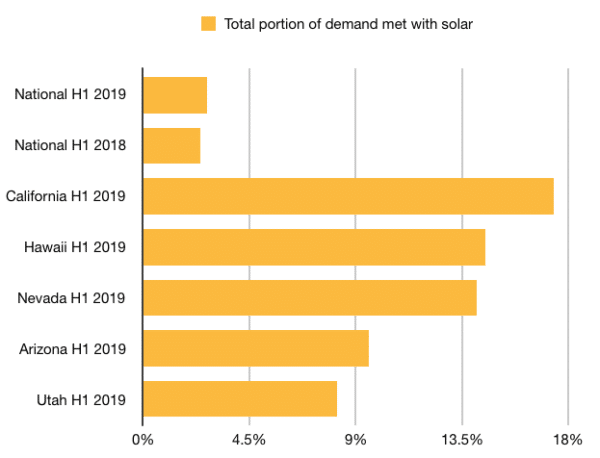 Hawaii was not far behind, with solar meeting 14.5% of demand. This portion is much higher on the island of Kaua’i, where solar met more than 1/4 of all electric demand last year. Nevada was near the level of Hawaii, with solar meeting 14.1% of demand.
After this there is a fairly large gap. The only states even close to meeting 10% of demand with solar are Arizona, at 9.6% of demand in the first half of 2019, and Utah at 8.2% of demand. Despite an impressive build-out over the last few years, in-state solar is still only meeting 5.5% of demand in North Carolina – around the same level as Vermont and Massachusetts.
At pv magazine we calculate the volume of solar generation in states as a portion of demand, not total generation. When calculated by generation, states such as Massachusetts and Vermont look much more impressive; however these states also import much of their power, and as such looking at solar as a portion of in-state generation can overstate actual progress.
This year solar markets are booming in Texas, Florida, the South and the Midwest, however these regions are still well behind the West when it comes to overall solar deployment, and it will take a number of years of steady growth to match the progress that has been seen in states like California and Hawaii.
And while we don’t expect any big increases in solar generation in the second half of 2019 due to the market interruption caused by the Section 201 tariffs, there is currently a record 9.8 GWdc of large-scale solar under construction and as such we are expecting more of an increase in 2020 figures.
This content is protected by copyright and may not be reused. If you want to cooperate with us and would like to reuse some of our content, please contact: editors@pv-magazine.com.


Nice summary. I usually crunch the numbers in terms of coal destruction. In those terms coal generation was down over 13% for the first half of the year and down over 22% in June alone. The June piece gives me hope for July and August.
Interesting, just 10 years ago there were those that claimed solar PV or wind generation would never catch on with just around 0.7% across the U.S.. Now the utilities are having fits with just 2.7% alternative energy being generated countrywide. It will also be interesting to see just how California will handle the loss of baseload nuclear by 2025 when Diablo Canyon is decommissioned. Right now during the day in March through May, California has enough solar PV and wind generation online, that CAISO has to ‘dump’ power to other States, more than likely Arizona, Utah and Wyoming. Giving other electric entities money to take MWh of generation during the day and using peak demand fueled electricity in the late afternoon to early evening when the sun goes down. California should have about 7GW of baseload energy generation. The Sun Desert nuclear plant was killed in 1976 with a stroke of a pen by Jerry Brown, SONGS had severe corrosion problems and had to be shutdown, then Diablo Canyon is due to be decommissioned by 2025. Just to replace these three plants an additional 21GWp energy needs to be constructed in California and at least a 25% distributed energy storage system along the grid to handle the sags and surges of the day on the grid. If large scale utility sized projects are all that is built and the costs can become on average $1/Watt for generation and energy storage can get down to the $100/kWh, then one could see a 25 to around 26 billion energy project. Will it be ready on time when that Diablo Canyon plant is shut down?
Hello Solarman,
1) When wind is counted, it is more like 10.4% variable renewable energy during H1 2019
2) I haven’t seen evidence that California is “dumping” power on neighboring states. Can you supply some documentation? What I have seen in CAISO curtailing solar *while it imports electricity from other states* due to inflexible contracts with out-of-state generators. See: https://pv-magazine-usa.com/2018/07/30/californias-solar-and-wind-integration-challenge/
3) Baseload is an outdated concept of running a grid, and not a technical requirement. California can have greater flexibility in the operation of its grid, more energy storage and zero baseload generation. These are choices.
4) It’s hard to keep up with the volume of your comments, as we editors have a lot of other tasks besides moderation. Slow it down a bit, eh?
Great article. Explains a lot of the nuance in the numbers. Thanks so much.
Thank you Michael!
great writing as always christian. unbelievable. i remember when I first started closely following solar and it was .7%. it has nearly quadrupaled since then. I think its was 2013. I bet it quadruples faster this time. the loss of the ITC will be a speed bump.