By Dr. Allison Weis & Mike Mendelsohn
 Battery storage is entering the electricity scene at an extraordinary pace. It seems the entire energy industry is looking closely at the technologies, economics, and financing hurdles to stand-alone storage options and renewable energy pairing opportunities.
There are four “S” factors critical to battery profitability: Siting, Sizing, Stacking, and (Bid) Strategy. In this piece, we break down those four elements and offer the development and investment community a starting point for due diligence analysis.
Siting
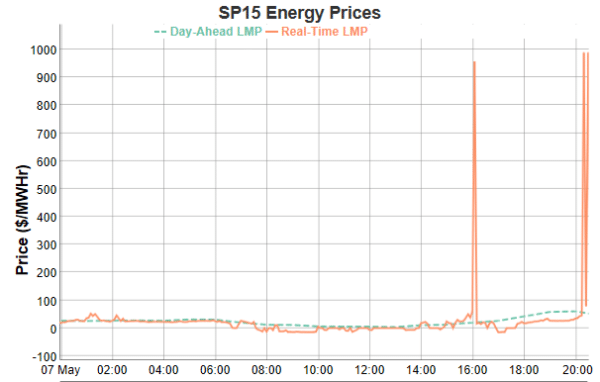
When bankrobber Willie Sutton was asked why he robbed banks, he famously responded, “that’s where the money is.” For battery storage, the money is in price spikes. Batteries operate as physical arbitrage machines to the volatile real-time energy market. Buy low, sell high. Transmission congestion and high load requirements have always been important contributors to price volatility. Now, variable generation adds a further multiplying effect, increasing the impacts of forecast error, creating a perfect environment for highly volatile market prices.
As the California Energy Imbalance Market (EIM) expands to a large portion of the western U.S., nodal volatility has become increasingly more important for those new regions trading into the CAISO system. Of course, the myriad of market forces (e.g., transmission expansion, behind-the-meter generation, vehicle electrification and new loads) will cause continual change in supply and demand relationships. But as renewables, with their difficult-to-forecast ramping behavior, become the dominant supply resources serving load, we believe price volatility, reflecting the fundamental need for flexible generation, will be with us for a long time.
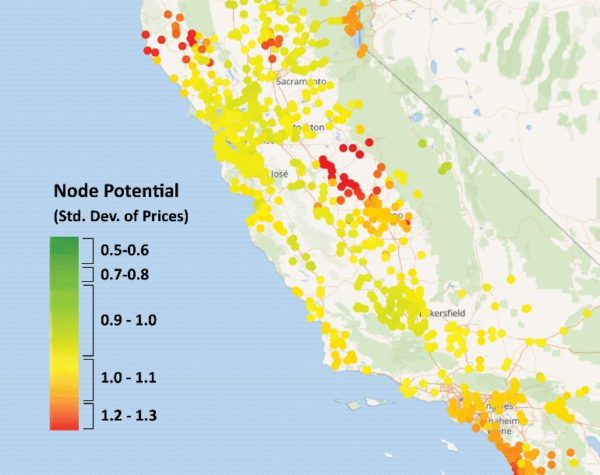
Figure 2 is a “heat map” of the California nodal system based on average 2015-2017 congestion persistence, a measure of price volatility. We see congestion-related volatility surrounding the urban areas, as expected, but also in interior sections of the state with significant renewable resource supplies and reduced access to loads. Nodal price analysis within supply or demand-constrained areas represents a valuable initial screen, but still needs to be combined with land cost, siting, and other considerations to find an optimal location.
Sizing
Battery sizing can be confusing and often misinterpreted. Power output and duration are generally multiplied together to calculate the energy capacity. However, a 5 MW battery capable of 4-hour duration (representing 20 MWhs) will have very different economics than a battery sized to 20 MW, 1-hour duration or a 40 MW, 30-minute duration asset.
The critical factor when targeting the volatile real-time market is in the quantity and duration of price spikes, both positive and negative. Most price spikes only persist for short bursts as real-time markets find equilibrium relatively quickly.
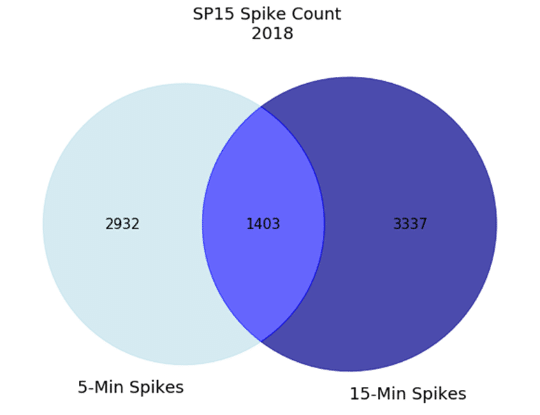
Regional market rules are also a primary input. California has two real time markets, a 5- and 15-minute. In California, the two RT markets are only modestly correlated. Volatility in one does not portend volatility in the second. In 2018, for example, spikes in the 5 and 15 minutes RT markets at the SP15 node overlapped only 22% of the time.
Stacking
There are 4 primary sandboxes a stand-alone or paired battery system can play in, represented by a 2×2 matrix: Day-Ahead and Real-Time scheduling cross-referenced with Energy and Ancillary Service markets. Ancillaries are further broken down into smaller categories. In the CAISO, for example, four ancillary products markets are established: regulation up, regulation down, spinning reserve and non-spinning reserve. Battery investment should be based on strategies to maximize revenue per increment of battery capacity, representing an analytic integration of battery location, sizing and bid strategy.
However, optimization is complex – the reason for the arbitrage opportunity, forecast error, translates to lack of perfect foresight. Nonetheless, advancements in machine learning have led to improved prediction in price spike probability. Meaning: good analytics and data capture can increase your odds of selecting the most profitable market to participate in.
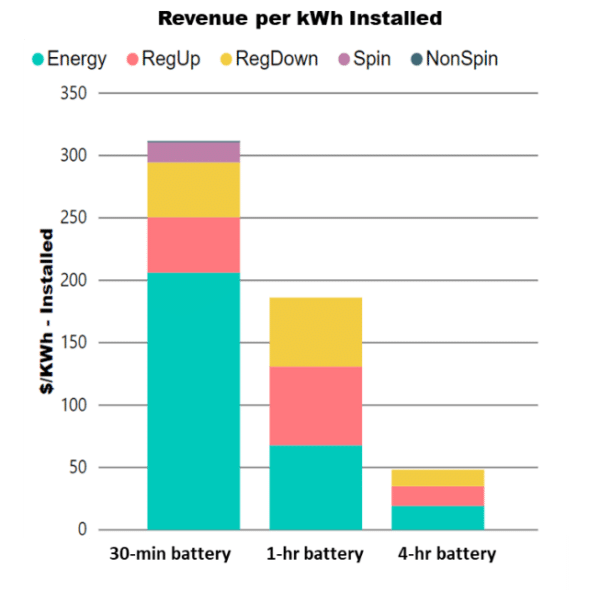
Figure 4 offers insight to an analysis we conducted for a client in the California market. We found, in this case, a shorter duration battery maximizes revenue in both regulation and energy markets (including both very low and negative prices for charging and very high prices for discharging) per unit of capacity installed.
While each battery investment is unique, our fundamental analysis indicates that RT energy market revenues will be the most valuable component of the revenue stack. While ancillary service prices are expected by some to increase across markets as renewable energy penetration progresses, as recently predicted by Lawrence Berkeley Labs, the volume represented in the ancillary service market is very thin relative to the energy market. Ancillary markets can become quickly saturated, leaving little opportunity for new flexible resources. Instead, our models show battery value will be maximized by capturing negative (or very low) prices to charge and erratic price spikes in RT markets to discharge, creating a powerful arbitrage opportunity that will be sustained over time due to the much larger volume of forecast error driving RT volatility.
Bid Strategy
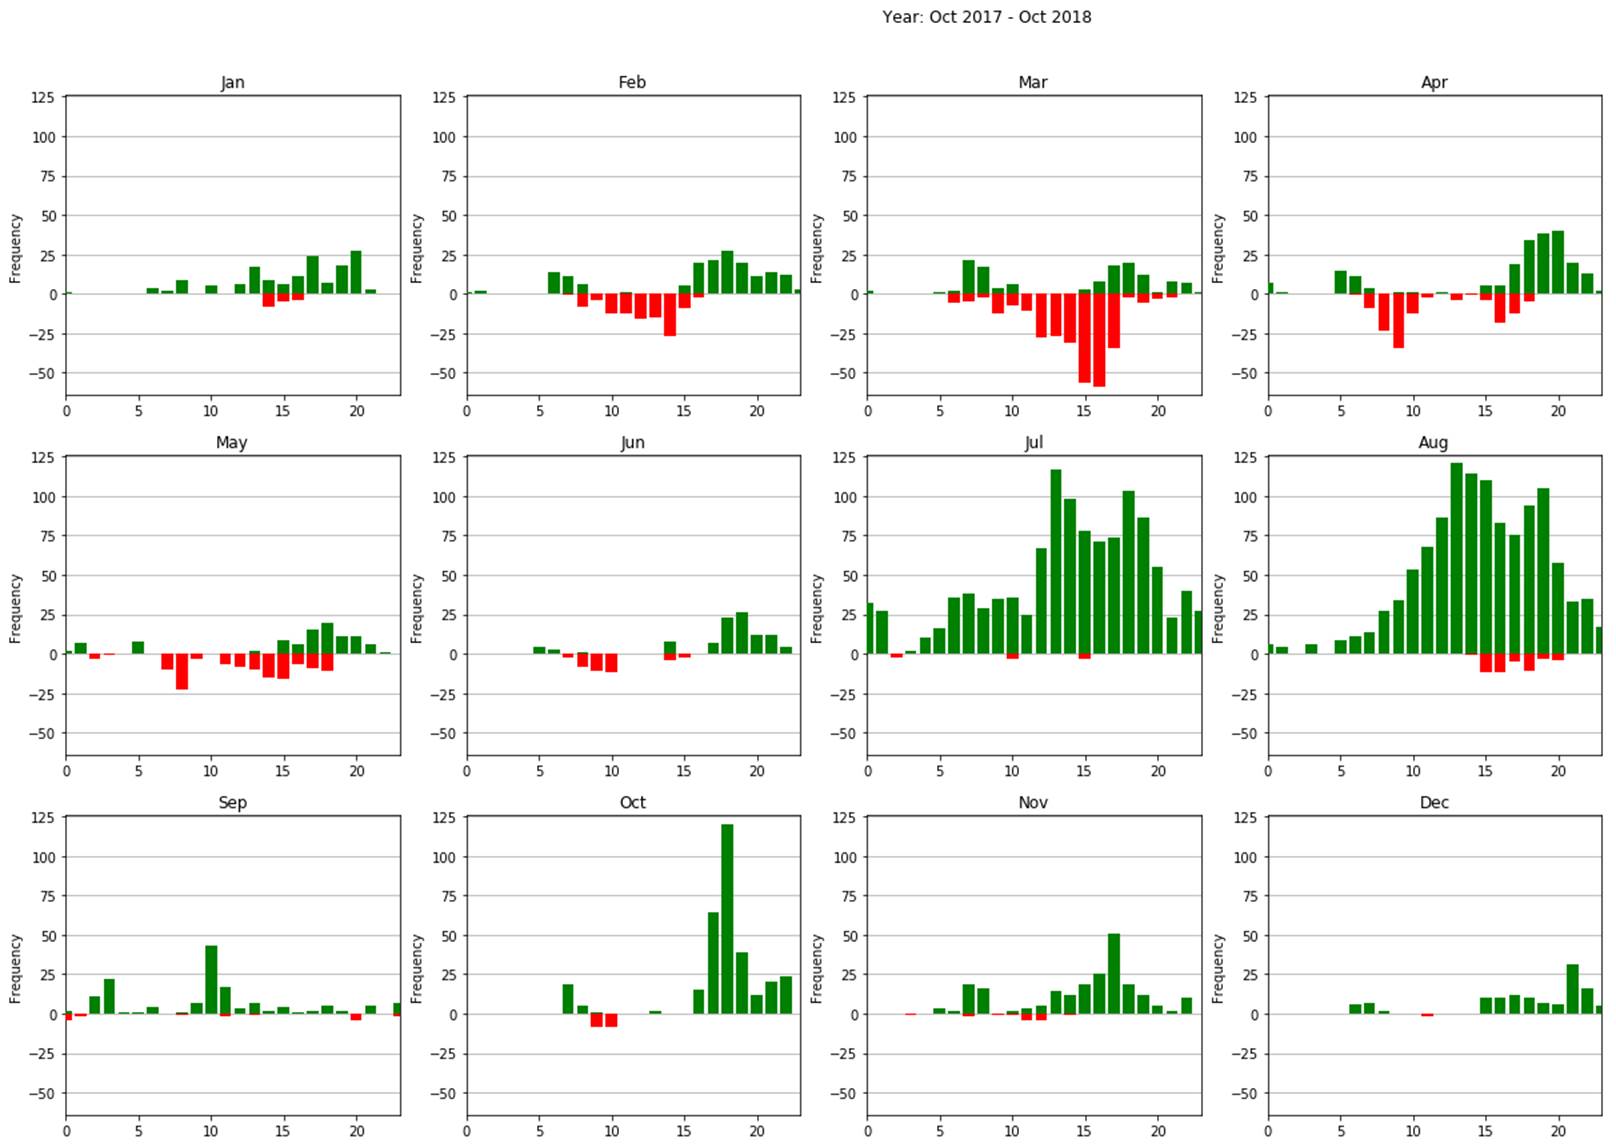
Once the battery investment is complete, it’s time to monetize the available revenue sources. Bid strategy will change seasonally and even week to week. For example, in spring and fall months, battery profit may be tied to soaking up negative or very low prices due to forecast error in the quantity of realized solar production. In contrast, July might see very few low or negative prices but far more upside volatility during the complex evening ramp as solar production declines and residential load obligations kick in.
Profit maximization will be tied to two primary factors: weather-derived, short-term (1-2 day) forecasting of price volatility, and continual evaluation of real-time market conditions and current battery state of charge to optimize next-day and next-hour energy and ancillary bids.
Batteries are the perfect tool to capture price volatility sure to come from our increasing reliance on variable energy resources. But good analytics will be the instruction set to use these tools to maximum effectiveness.
Key Takeaways:
- Battery projects should be sited to take advantage of market price dynamics, particularly growing volatility driven by renewables, which is most consistent near load centers
- Co-optimization between energy and ancillaries and day-ahead and real-time significantly increases the value of storage
- Intelligent bidding strategies that adjust in real-time are key for realizing maximum revenues from projects in operation
Mike Mendelsohn serves as manager of marketing & analytics at Ascend Analytics. Dr. Alison Weis is the company’s manager of optimization analysis.
This content is protected by copyright and may not be reused. If you want to cooperate with us and would like to reuse some of our content, please contact: editors@pv-magazine.com.


The specifics of the battery storage capacity and number of hours of this capacity is a far greater determination than the old, centralized generation facility. One might have a 200MW Peaker plant, but an energy storage facility can be tailored to the actual grid demands. It seems many important stacked grid functions can be handled by the energy storage system that may work from a few seconds to a few minutes to keep the grid regulated during fluctuating demands. Locally, these would be very valuable for the get up in the morning surges, get home after work surges in energy use during the day. Regional energy storage with several hours of demand output would help store intermittent energy over generation during the day and help old generation facilities to run at night charging the batteries for the early morning demand surge once again.
it doesn’t seem economical yet.
200 euros per kw-h= 200,000 euros investment for 1 Mw-h battery.
a battery can charge and recharge 3000 times.
a Mw-h is assumed to bring in a profit of 30-70 euros.
@ 30Euros a megawatt trading margin profit the total return of the investment comes to (30 euros per mw-h)*(3000 cycles)*(1Mw-h)=90,000 euros. For Margins of 70 euros per trade the return on investment comes to about 210,000, not a big return.
Now to see how long it takes. How many 30 -70 euro margins are there on the grid. it probably won’t be more than 1 trade a day. 3000 cycles(trades)/365 =about 8 years and hardly any return.
Can you share any feed back on the meeting with Mullen Technologies and there initiative regarding the electric vehicle market?
only 50% of this lithium junk is recycled,
https://www.pv-magazine.com/2019/07/12/lithium-ion-recycling-rates-far-higher-than-some-statistics-suggest/
no doubt it pollutes the seas and land.
First solve that problem and put that in your financial assumptions to recycle it.
Hello Hendrik,
I think some information on the relative toxicity of lithium and lithium compounds is needed here, because that is another essential factor in whether or not used lithium ion batteries will pollute “the seas and land”.
– Christian
https://www.youtube.com/watch?v=EvOvVuQcRRI
Lithium batteries are generally considered not an environmental hazard except when containing toxic (heavy) metals and disposed of in large quantities. The literature survey has indicated that lithium is not expected to bioaccumulate, and that its human and environmental toxicity are low.
Im curious to wether there is industry support for these studies.
That’s what I’ve heard as well regarding the toxicity of lithium-ion batteries.
We should have dedicated recycling of these batteries per circular economy principles. But there are a lot of things that should happen, and I like to focus on the bigger problems/dangers.
Yes they should be recycled 99%, but of the 50%, a lot, is probably done in China, like household waste, those numbers are probably lower. https://www.change.org/p/politcal-system-final-recycling-processes-in-the-us-and-europe?recruiter=1008106848&recruited_by_id=e772e660-e7b3-11e9-9806-fff85b8d1ef1&utm_source=share_petition&utm_medium=copylink&utm_campaign=petition_dashboard
For me batteries are not as good as pumped hydro, simply due to the reason where the finances go and longitude of the project.
https://www.youtube.com/watch?v=oKFOqMZmuA8
1.45:
“the waste materials of batteries can be toxic, we have metal oxides, phosphate, as aswell as aluminium copper but there is also harmfull ltihium salts and plastics lead manganese, nickel, cobalt”
I do have to admit I did think because its a mineral thats mined, has a green colour and is used in a battery expected the toxicity of lithium ion to be a problem, like with the other substances, but paid research shows this might not be the case. It does however have other toxic components.
Thanks for your information