Today we got our first real estimate of solar installations in 2018, which indicates that despite four different rounds of tariffs – not to mention net metering and rate design battles and the gutting of PURPA at the state level – solar installations still grew 6% in 2018 to 11.7 GWdc.
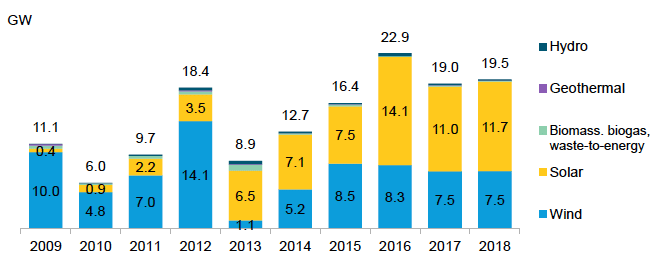
Graphic: BNEF
Bloomberg New Energy Finance (BNEF) released these numbers as only one data point in its Sustainable Energy in America Factbook, published in collaboration with the Business Council for Sustainable Energy. The report also examines the rise of natural gas capacity, and a 2.2% bump in emissions over 2017 levels, driven by more extreme weather and higher natural gas use.
However, in the report’s executive summary, it provides more detail, stating that:
Continued uncertainty over solar and metals tariffs weighed on purchasing decisions in the first half of the year; meanwhile, developers are replenishing pipelines following 2016’s 14.1GW and before the step-down of the federal Investment Tax Credit.
The year-end recovery against these factors appears to have caught BNEF by surprise. As recently as November the company was predicting that only 10.2 GWdc would be installed over the course of 2018, while the numbers released today are 15% higher.
Shifting market drivers
What is clear is that 2018 was a year of change for the U.S. solar market. While the residential solar market has stagnated year-over-year due to end of net metering in several states, as well as the ongoing sluggishness of the California market, utility-scale drivers appear to be shifting.
In previous years project contracts secured under the Public Utilities Regulatory Policies Act of 1978 (PURPA) were a growing driver of the utility-scale market, but in 2018 these appear to have fallen away, with Wood Mackenzie Power & Renewables estimating that only 300 MWdc of solar was installed under PURPA in 2018.
However, corporate solar procurement seems to be more than making up for the fall in PURPA projects. BNEF estimates that large purchasers signed contracts for 8.6 GW of wind and solar in 2018, more than twice the previous record of 3.4 GW contracted in 2015. BNEF goes into particular detail on this point:
Procurement reached into new markets, as companies such as Facebook, Google and Walmart worked together with vertically integrated utilities in New Mexico, Georgia and Tennessee (among others) to build new wind and solar projects. New aggregation models also arose, allowing smaller energy buyers like Etsy and Adobe to combine their demand to sign onto an individual project, thereby leveraging economies of scale previously only open to large consumers.
Battery installations grow
BNEF also reports that 292 MW of battery storage was installed over the course of 2018, which it notes is much higher than the 200 MW of average annual installations over the course of the last three years.
But this capacity number may hide a larger increase, as BNEF notes that the average duration of the batteries installed increased to two hours from one hour, meaning that around 600 megawatt-hours of batteries were installed. Also, the company notes that the use cases for batteries is getting broader.
Meanwhile, batteries are being deployed for a more diverse suite of applications, including for meeting resource adequacy requirements in California, pairing with solar and wind to help increase dispatchability in the Southwest and Hawaii, and offsetting demand charges on commercial and industrial power bills.
BNEF notes that the base of installed batteries is still much smaller than pumped hydro, which remains the largest source of energy storage in the United States. And while there were no new pumped hydro projects installed, BNEF says that as of October applications had been filed with federal regulators for 2.3 GW of new pumped hydro plants.
EVs grow
Finally, BNEF also showed that electric vehicle (EV) sales are growing, hitting 3% of total automobile sales during the fourth quarter, up from 1.3% in the fourth quarter of 2017.
Behind both the growth in battery storage and EV deployments is a fall in lithium-ion battery prices, which the company estimates fell 18% year-over-year. Another factor was Tesla’s Model 3 hitting the market, which is not only the top EV model but also the best-selling luxury car in the United States. Overall, 138,000 Model 3s were sold in 2018.
Additionally, for the first time in 2018 EV sales exceeded hybrid sales, indicating that the transition to pure electric transport may be faster than anticipated.
This content is protected by copyright and may not be reused. If you want to cooperate with us and would like to reuse some of our content, please contact: editors@pv-magazine.com.


By submitting this form you agree to pv magazine using your data for the purposes of publishing your comment.
Your personal data will only be disclosed or otherwise transmitted to third parties for the purposes of spam filtering or if this is necessary for technical maintenance of the website. Any other transfer to third parties will not take place unless this is justified on the basis of applicable data protection regulations or if pv magazine is legally obliged to do so.
You may revoke this consent at any time with effect for the future, in which case your personal data will be deleted immediately. Otherwise, your data will be deleted if pv magazine has processed your request or the purpose of data storage is fulfilled.
Further information on data privacy can be found in our Data Protection Policy.