First, say these three words out loud: Investment Tax Credit (ITC). Then, let’s wander back to 2015 and 2016 when the US solar power market saw massive growth as the original 30% tax credit legislation was doing its political dance. And now, lets almost double the total capacity that will be deployed and you’ve got a taste of what’s coming in the 2019 and 2020 seasons.
A quarterly report by Stephanie Tsao and Ellen Meyers of S&P Global Market Intelligence estimates that the U.S. utility scale solar project pipeline through 2022 has expanded to 33.9 GWac. The total capacity added to the pipeline in Q3 was 5.8 GW.
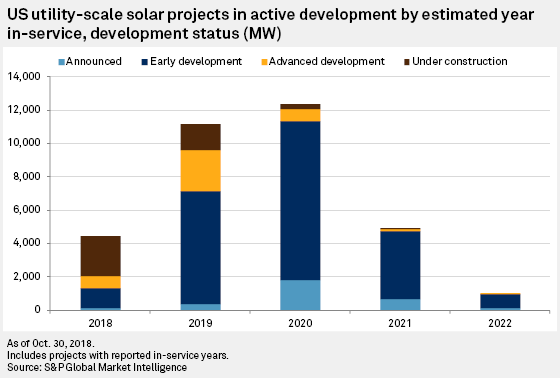
Concurrently with the good news, is that the United States only added 357 MW of utility-scale solar in the quarter – down almost 60% from last year’s Q3. If 2018 ends around 4 GWac, 2019 will more than double the utility scale volume – and 2020 will triple the number.
The 2019-2020 pipeline has seen significant growth this year – taking 5.2 of the 5.8 GWac of volume growth in Q3. Since the end of the first quarter, the pipeline for the next two years has grown from 15.4 GW at the end of Q1, to 18.3 GW at the end of Q2, to the current 23 GW.
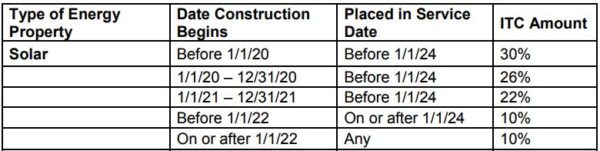
With the ITC dropping from 30% to 26% in 2020, 22% in 2021, and 10% beyond – 2019 is expecting to see significant construction starts. And since the IRS, via Notice 2018-59, modified the ITC to allow solar projects to begin construction by the end of the 2019, and still get the 30% – versus being in service by that date – there will be many ground breakings that occur next year for projects that will begin operating before the end of 2023.
Of the projects announced in Q3, the 300 MWac Hecate Energy project in Ohio was the largest. The largest project currently in advanced development is the Spotsylvania 500 MW project by sPower.
The most recent FERC Energy Infrastructure Update (.pdf) sees just over 61 GWac of solar power in its pipeline.
Also of note is that this report doesn’t include either residential or the commercial & industrial sectors. Data from other projections suggest that another 4-5 GWdc is coming from those two sectors combined. Adding that volume to the S&P projections with a DC:AC ratio of 1.25:1 applied, suggests that the United States might build 18 GWdc of solar power in 2019, and just over 19 GWdc in 2020.
This content is protected by copyright and may not be reused. If you want to cooperate with us and would like to reuse some of our content, please contact: editors@pv-magazine.com.


I looked at the FERC Dec 2017 data and compared it to the Sep 2018 data. Some things of interest:
Solar:
Dec 2017: cap=30.30GW, add=47.07GW, retire=0.002GW
Sep 2018: cap=34.63GW, add=61.62GW, retire=0.002GW
Solar gained 4.33GW in installed capacity and planned additions grew 14.55GW.
Wind:
Dec 2017: cap=88.53GW, add=79.77GW, retire=0.068GW
Sep 2018: cap=91.67GW, add=89.88GW, retire=0.050GW
Wind added 3GW in installed capacity and the planned additions grew 10GW.
NG:
Dec 2017: cap=517.1GW, add=92.7GW, retire=10.8GW
Sep 2018: cap=522.6GW, add=79.4GW, retire=12GW
NG added only 5.5GW in installed capacity and the planned additions went down 13.4GW and retirement grew 1.2GW.
My analysis (along with most people looking closely at the solar industry) also finds that solar is in a good place for growth– in the United States it may feel like things have never been better, but I really do think the solar revolution has only just begun, especially when you look at utility-scale solar trends: http://chesterenergyandpolicy.com/2018/11/30/identifying-signs-of-the-solar-revolution-using-maps-and-graphs/