
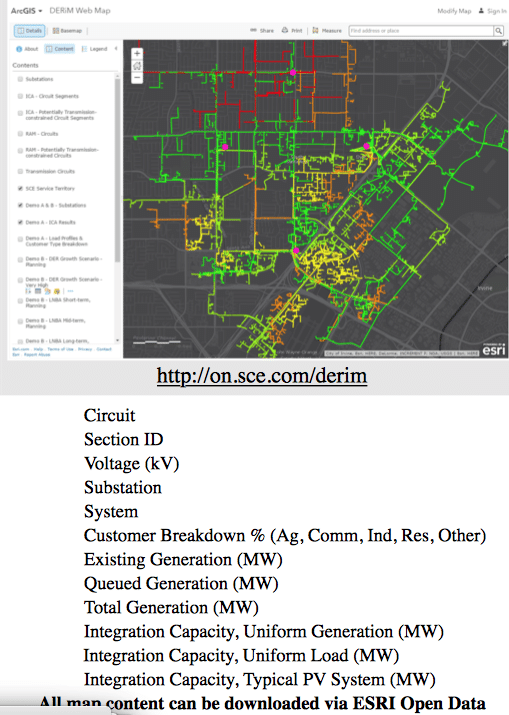
California’s Integration Capacity Analysis (ICA) maps were first launched in 2015 with the goal of giving insight into local grid traffic, so as to guide the engineering and deployment of solar power in those areas. If you consider that the U.S. power grid is often remarked as the world’s largest (and most complex) machine, then you could understand why it’d be nice to have a map of sorts before you spend tens of thousands developing a project.

In the run up to the public release of the ICA 2.0 maps, the state’s electric utilities requested a delay until December of 2018 on the project so they could hide strategic assets. Distributed resource advocacy organization Clean Coalition argued:
The issue did not apply to the already available maps, which are the same maps used for ICA 2.0. We agree that there may be some information (TBD) related to specific equipment (TBD) that may appropriately be considered sensitive, but the IOUs have not specified any, and we have argued that general locational information is inherently not sensitive, as affirmed by FERC rulings.
At this point, the utilities also took down the 1.0 version of the maps, limiting access to those who sign an non-disclosure agreement and request specific grid information, slowing the process down greatly. Clean Coalition asked the judge to rule on this, suggesting prior rulings hadn’t originally intended this.
On October 9, an Administrative Law Judge’s ruling regarding photovoltaic renewable auction mechanism maps (PDF) was handed down, which states
July 24, 2018 ruling was not intended to address the requirements set forth in D.10-12-048 and Resolution E-4414 regarding making Photo Voltaic Renewable Auction Mechanism Maps (PV RAM Maps) publicly available.
See you on Sunday!
The ICA 2.0 maps are currently available. However, the proposed process involves signing an NDA and requesting the information on specific potential solar plant installations and waiting for the data to be delivered, but no NDA has yet been approved. The current December 31 deadline makes those documents publicly accessible.
In Massachusetts, the pre-application process can take weeks to a couple of months to get a local analysis back. The state has provided a monthly updated circuit occupancy and distributed application “map” – but this map is in Microsoft Excel, and it doesn’t give specific location data on the substations or the circuits that your project might be on for security purposes. However, once the pre-application comes back though, you get a great combination of data between it and the spreadsheets. See below (which in this case, meant build out challenges).


This particular pre-application was submitted on June 6, 2018 and it was received back from Eversource Utility on July 27, 2018.
In speaking with pv magazine yesterday – Rosana Francescato, Sahm White, and Doug Karpa of Clean Coalition – talked about future plans when rolling out ICA 2.0.
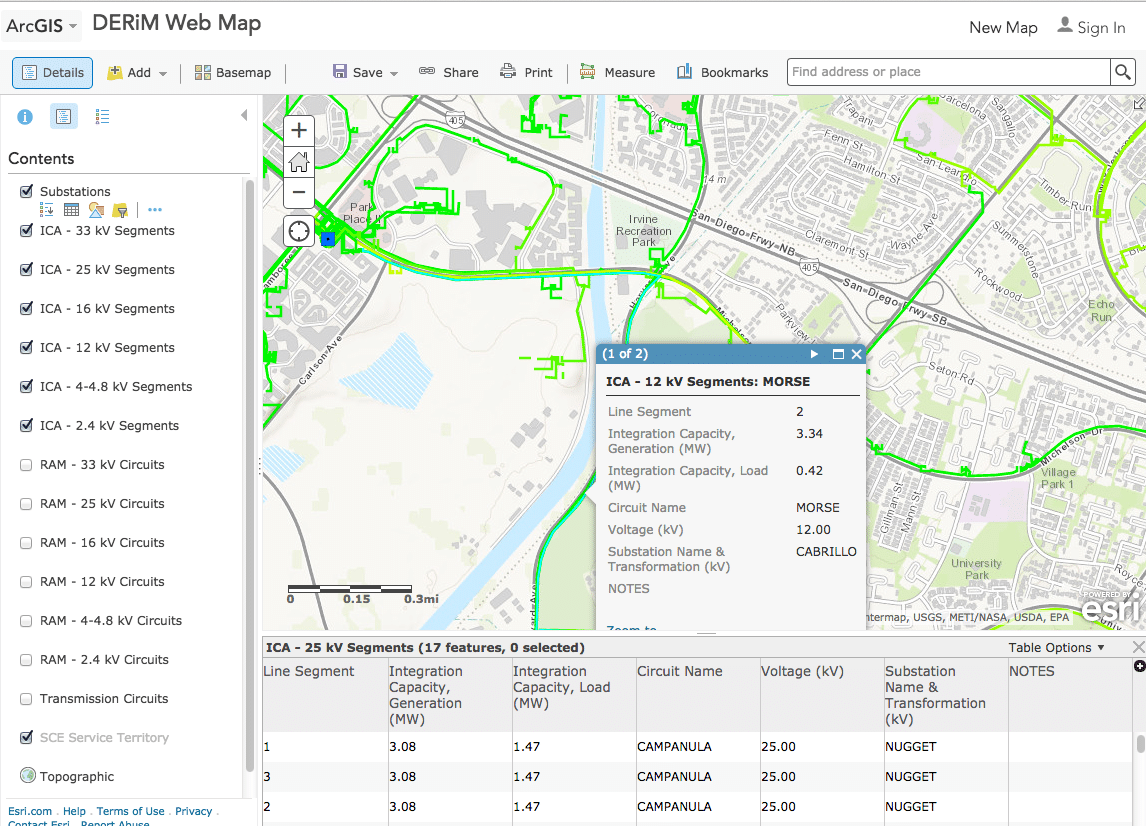
For instance, the new maps allow an analysis of every node on the primary circuit. This updated version of the software also offers an hourly energy profile of the locations, which a developer can use to better fit their solar production curve (and batteries) inside of.
Sahm White described the overall project goal
Mitigation of higher solar penetration. The whole idea of the map is faster, easier, predictable power flow analysis of the entire grid. We can look at the output, we update it every month, with how much is changing, and we do it at every connection.
Music to a developer’s ears.
This content is protected by copyright and may not be reused. If you want to cooperate with us and would like to reuse some of our content, please contact: editors@pv-magazine.com.


By submitting this form you agree to pv magazine using your data for the purposes of publishing your comment.
Your personal data will only be disclosed or otherwise transmitted to third parties for the purposes of spam filtering or if this is necessary for technical maintenance of the website. Any other transfer to third parties will not take place unless this is justified on the basis of applicable data protection regulations or if pv magazine is legally obliged to do so.
You may revoke this consent at any time with effect for the future, in which case your personal data will be deleted immediately. Otherwise, your data will be deleted if pv magazine has processed your request or the purpose of data storage is fulfilled.
Further information on data privacy can be found in our Data Protection Policy.