At the request of the Public Service Commission of Maryland, in September of 2016, an economic analysis of the state’s power grid was requested. A subcomponent of that analysis was to look at solar power and determine:
the benefits and costs as they accrue to or affect (1) the bulk power system, (2) local power distribution systems, and (3) society and the economy.
Daymark Energy Advisors was contracted to complete the 209 page report.
First off, an eye popping value of ~31-42¢/kWh in benefits for distributed solar power is one of the highest numbers pv magazine has seen, and it having such a significant distance from utility scale is surprising. The retail costs of electricity in Maryland range from 9.5-13¢/kWh.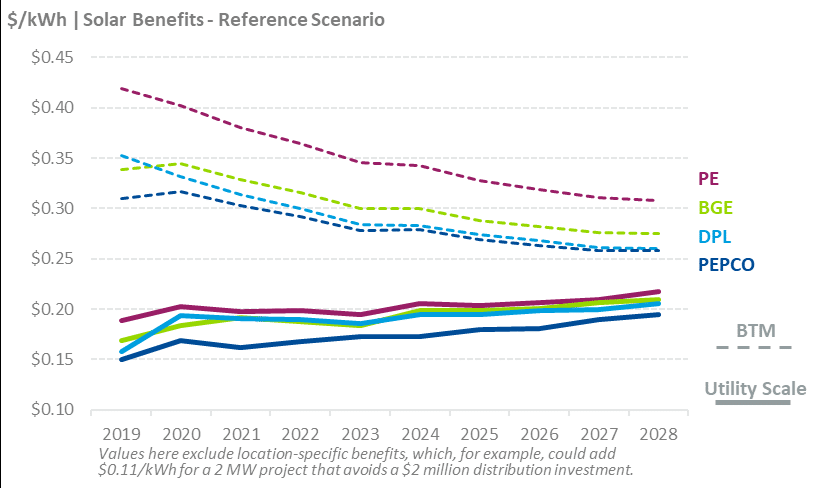
The driver of this separation is almost entirely based upon the economic value of labor associated with these two forms of implementing solar power. In Figure 2 below you see ~12¢/kWh coming from economic benefits – and in Figure 3 below that value is a whopping 35¢/kWh.
In essence – the relative installation inefficiency of distributed solar power versus utility scale solar creates economic value. The study broke down supply chain, sales, construction and other related fields on a zip code level to estimate job years created and associated dollar value.
What we’re really saying is: It’s the economy, stupid.
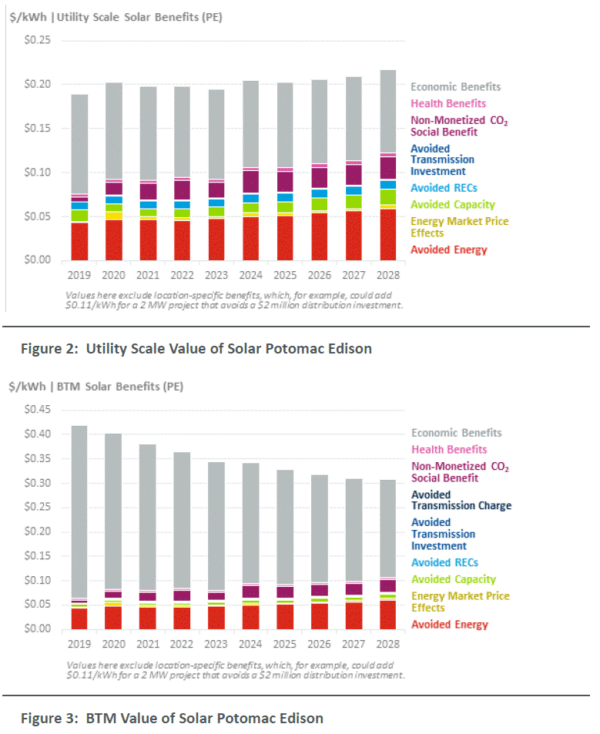
One important piece of information – in addition to these values above – is that the default figures used to reach the broader conclusions of the paper didn’t include benefits to the distribution grid. The report referenced a specific case study which found that in the right location the value of solar could be as much as 11¢/kWh higher due to avoided upgrades equal to $2 million.
California’s grid operator says distributed energy and efficiency recently knocked off $2.6 billion in transmission lines and other infrastructure investments.
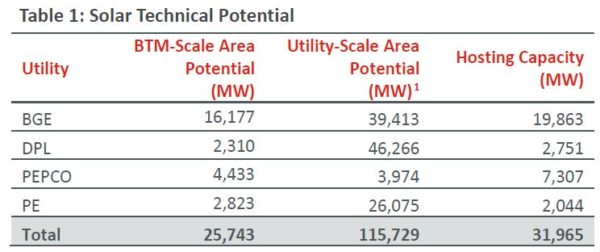
The report also looked at the sustainability of the economic benefits by projecting total solar capacity potential. Maryland’s current “hosting capacity” – essentially how much solar would be needed to meet the state’s electricity demand – is about 32 GW. This is a significant relative to the current total of 53 GW installed in the United States.
But the total potentials for PV is greater than what is currently installed in the whole of the United States currently, suggesting that a significant portion of the state of Maryland’s workforce could be employed for a entire generation or more during the energy transition that electrifies transportation, heating and industry.
2017 saw more money spent on solar capacity than oil, coal, gas and nuclear combined, and in the United States, its projected that the solar industry will return to job growth after a 2017 tightening. This may be only the beginning, as some reports suggest that the United States could build a lot more solar than is currently projected.
We are all aware that its money that makes the world go around, and that when people’s ability to earn that money is affected they tend to get active politically. The United States has definitely seen solar power flex its political might as installation volume has increased – and this document shows why that flexing has been so potent: solar spreads the money widely.
This content is protected by copyright and may not be reused. If you want to cooperate with us and would like to reuse some of our content, please contact: editors@pv-magazine.com.


By submitting this form you agree to pv magazine using your data for the purposes of publishing your comment.
Your personal data will only be disclosed or otherwise transmitted to third parties for the purposes of spam filtering or if this is necessary for technical maintenance of the website. Any other transfer to third parties will not take place unless this is justified on the basis of applicable data protection regulations or if pv magazine is legally obliged to do so.
You may revoke this consent at any time with effect for the future, in which case your personal data will be deleted immediately. Otherwise, your data will be deleted if pv magazine has processed your request or the purpose of data storage is fulfilled.
Further information on data privacy can be found in our Data Protection Policy.