
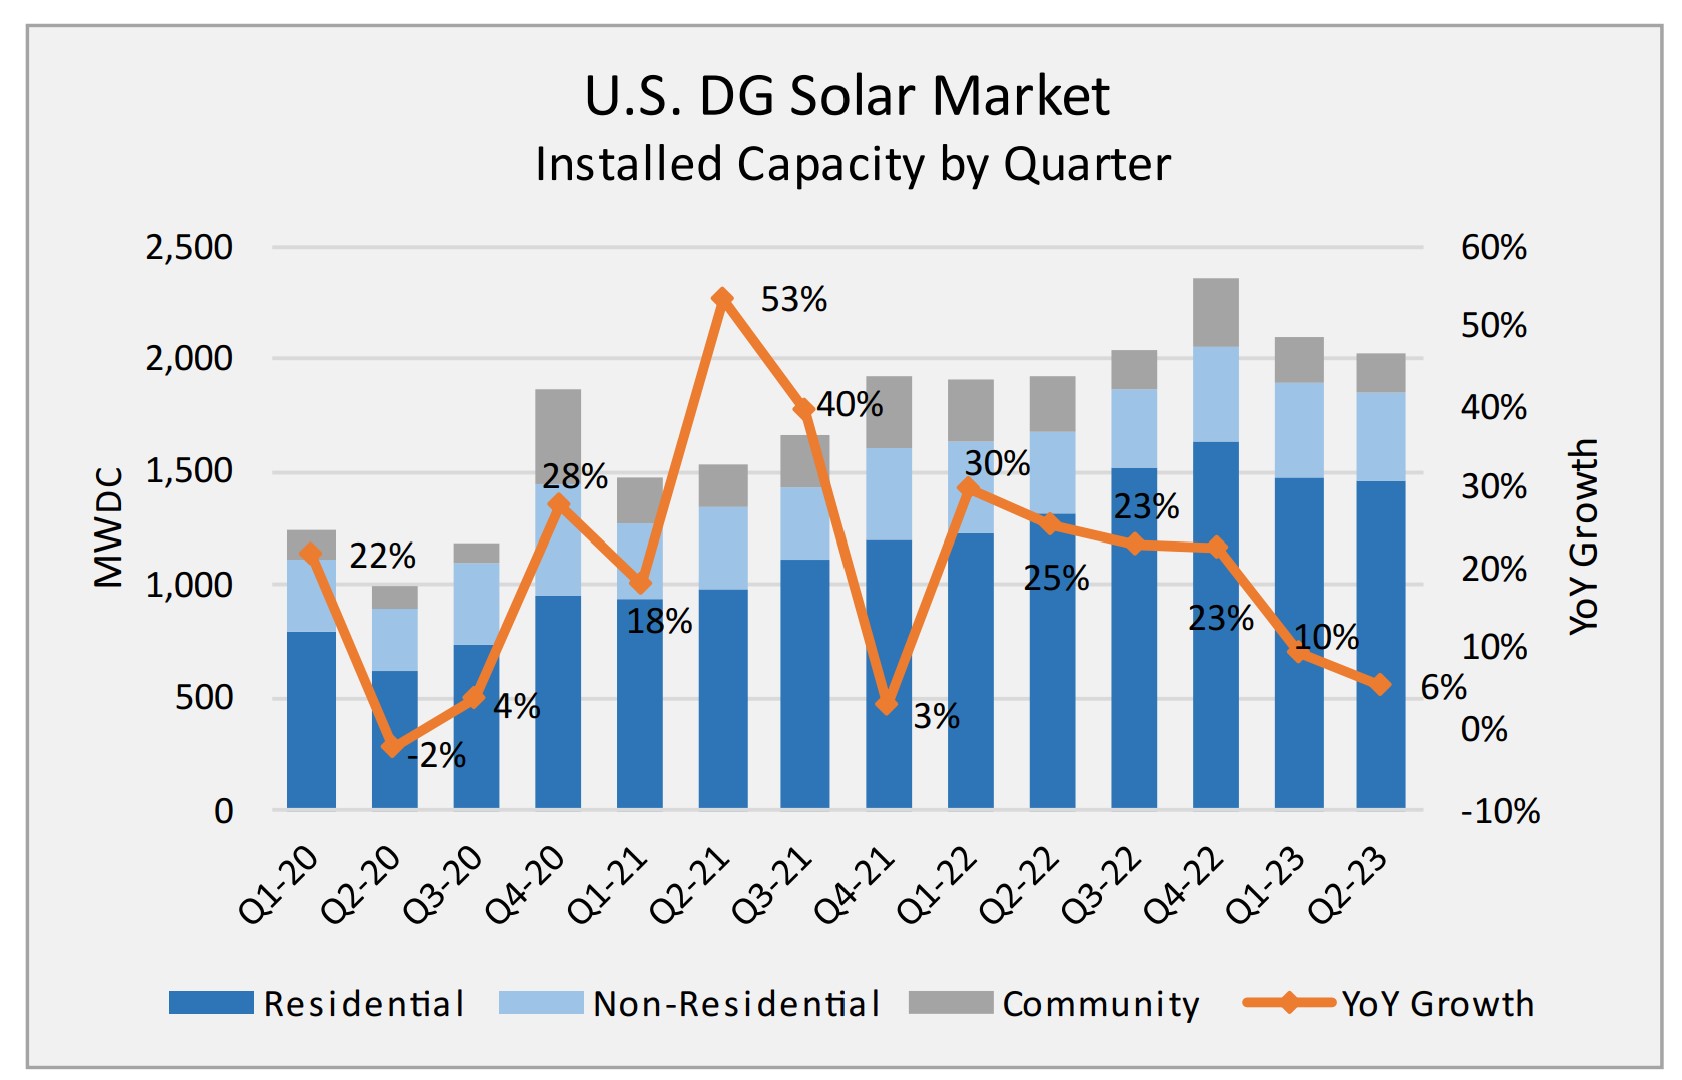
Ohm Analytics’ second-quarter report on distributed solar generation paints a complex picture across the residential, commercial & industrial (C&I), and community solar sectors. Overall, the market expanded by 6%, buoyed by an 11% increase in residential solar, but hampered by a 24% decline in community solar. The C&I sector held its own with 7% growth.
The rise in residential solar can be attributed to two key factors. The first is a resurgence of third-party ownership, partially resulting from enhanced value stemming from the Inflation Reduction Act, but also from increasing interest rates. Additionally, California’s NEM 2.0 program, which ended on April 14 this year, led to a surge in applications and installations.
In Massachusetts, third-party ownership of residential solar projects jumped from 37% in October 2022 to 57% in July, marking a 54% increase. On a national scale, third-party entities own 25% of all residential solar installations. This number is somewhat deflated by California’s NEM 2.0 program, which had motivated private ownership.
Ohm Analytics reported an addition of 1,466 MW of residential solar capacity. In California, the growth rate was 23% year-over-year. Complementing California, the combined growth for New York, New Jersey, Connecticut, and Massachusetts stood at 29%. These gains counterbalanced sluggish markets in Arizona (down 4%), Texas (down 20%), and Florida (down 5%). The backlog from California’s NEM 2.0 is anticipated to bolster installation rates through the end of the Q4.
California’s NEM 3.0 appears to have kickstarted the energy storage attachment rate that the state envisioned, with current sales recording a 70% attachment rate.
Joseph Wyer of Ohm pointed out the rising interest rates for residential solar, with a current median APR of 4.49%. This is a significant increase from the 1.99% median APR reported in 2022. Wyer suggested that these rising finance costs are eroding the value proposition for residential solar:
I think the most interesting and clear story right now looking at the raw data is the regional financing trends, especially in the northeast.
Outside of the residential market, installation volume is more muted.
The C&I market witnessed the installation of 385 MW, marking a 7% year-over-year growth. Declines in major markets like California and New Jersey were partly offset by single digit growth in states such as Arkansas, Georgia, Pennsylvania, and Illinois. Drawing on permit growth and industry feedback, Ohm Analytics projects encouraging installation figures for the C&I sector in the upcoming quarters.
Despite a 9% rise in prices to $1,093 per kWh, energy storage installation volumes in the C&I sector grew, albeit from a small base, by 52% year-over-year.
In the distributed solar sector, community solar lagged with a 24% decline in Q2. However, this was still an improvement, as it recorded 185 MW, outperforming the previous quarter’s more dismal numbers. Ohm Analytics cited interconnection challenges in Massachusetts and Maine as growth roadblocks but remains optimistic for the tail end of 2023 and the trajectory into 2024-2025.
Another challenge for the community solar market is its “solar coaster” nature; it relies on programs with limited capacity that are subject to slow-moving political developments. For example, Illinois has a lottery-based community solar market, and installations based on last year’s lottery result are just getting underway. Meanwhile, New Jersey’s community solar program has been stagnant for a year as the state prepares to launch a more permanent initiative.
These challenges suggest that the community solar market may fall short of the Biden administration’s target of 27 GW of solar by 2025.
This content is protected by copyright and may not be reused. If you want to cooperate with us and would like to reuse some of our content, please contact: editors@pv-magazine.com.


By submitting this form you agree to pv magazine using your data for the purposes of publishing your comment.
Your personal data will only be disclosed or otherwise transmitted to third parties for the purposes of spam filtering or if this is necessary for technical maintenance of the website. Any other transfer to third parties will not take place unless this is justified on the basis of applicable data protection regulations or if pv magazine is legally obliged to do so.
You may revoke this consent at any time with effect for the future, in which case your personal data will be deleted immediately. Otherwise, your data will be deleted if pv magazine has processed your request or the purpose of data storage is fulfilled.
Further information on data privacy can be found in our Data Protection Policy.