The U.S. Department of Energy’s Energy Information Administration (EIA) has issued its latest Electric Power Monthly update, which provides data through the end of April. The update reveals that solar photovoltaic generation rose by 16.6% from April of the previous year, accounting for just over 7% of total U.S. electricity generated that month, up from 6% in 2022.
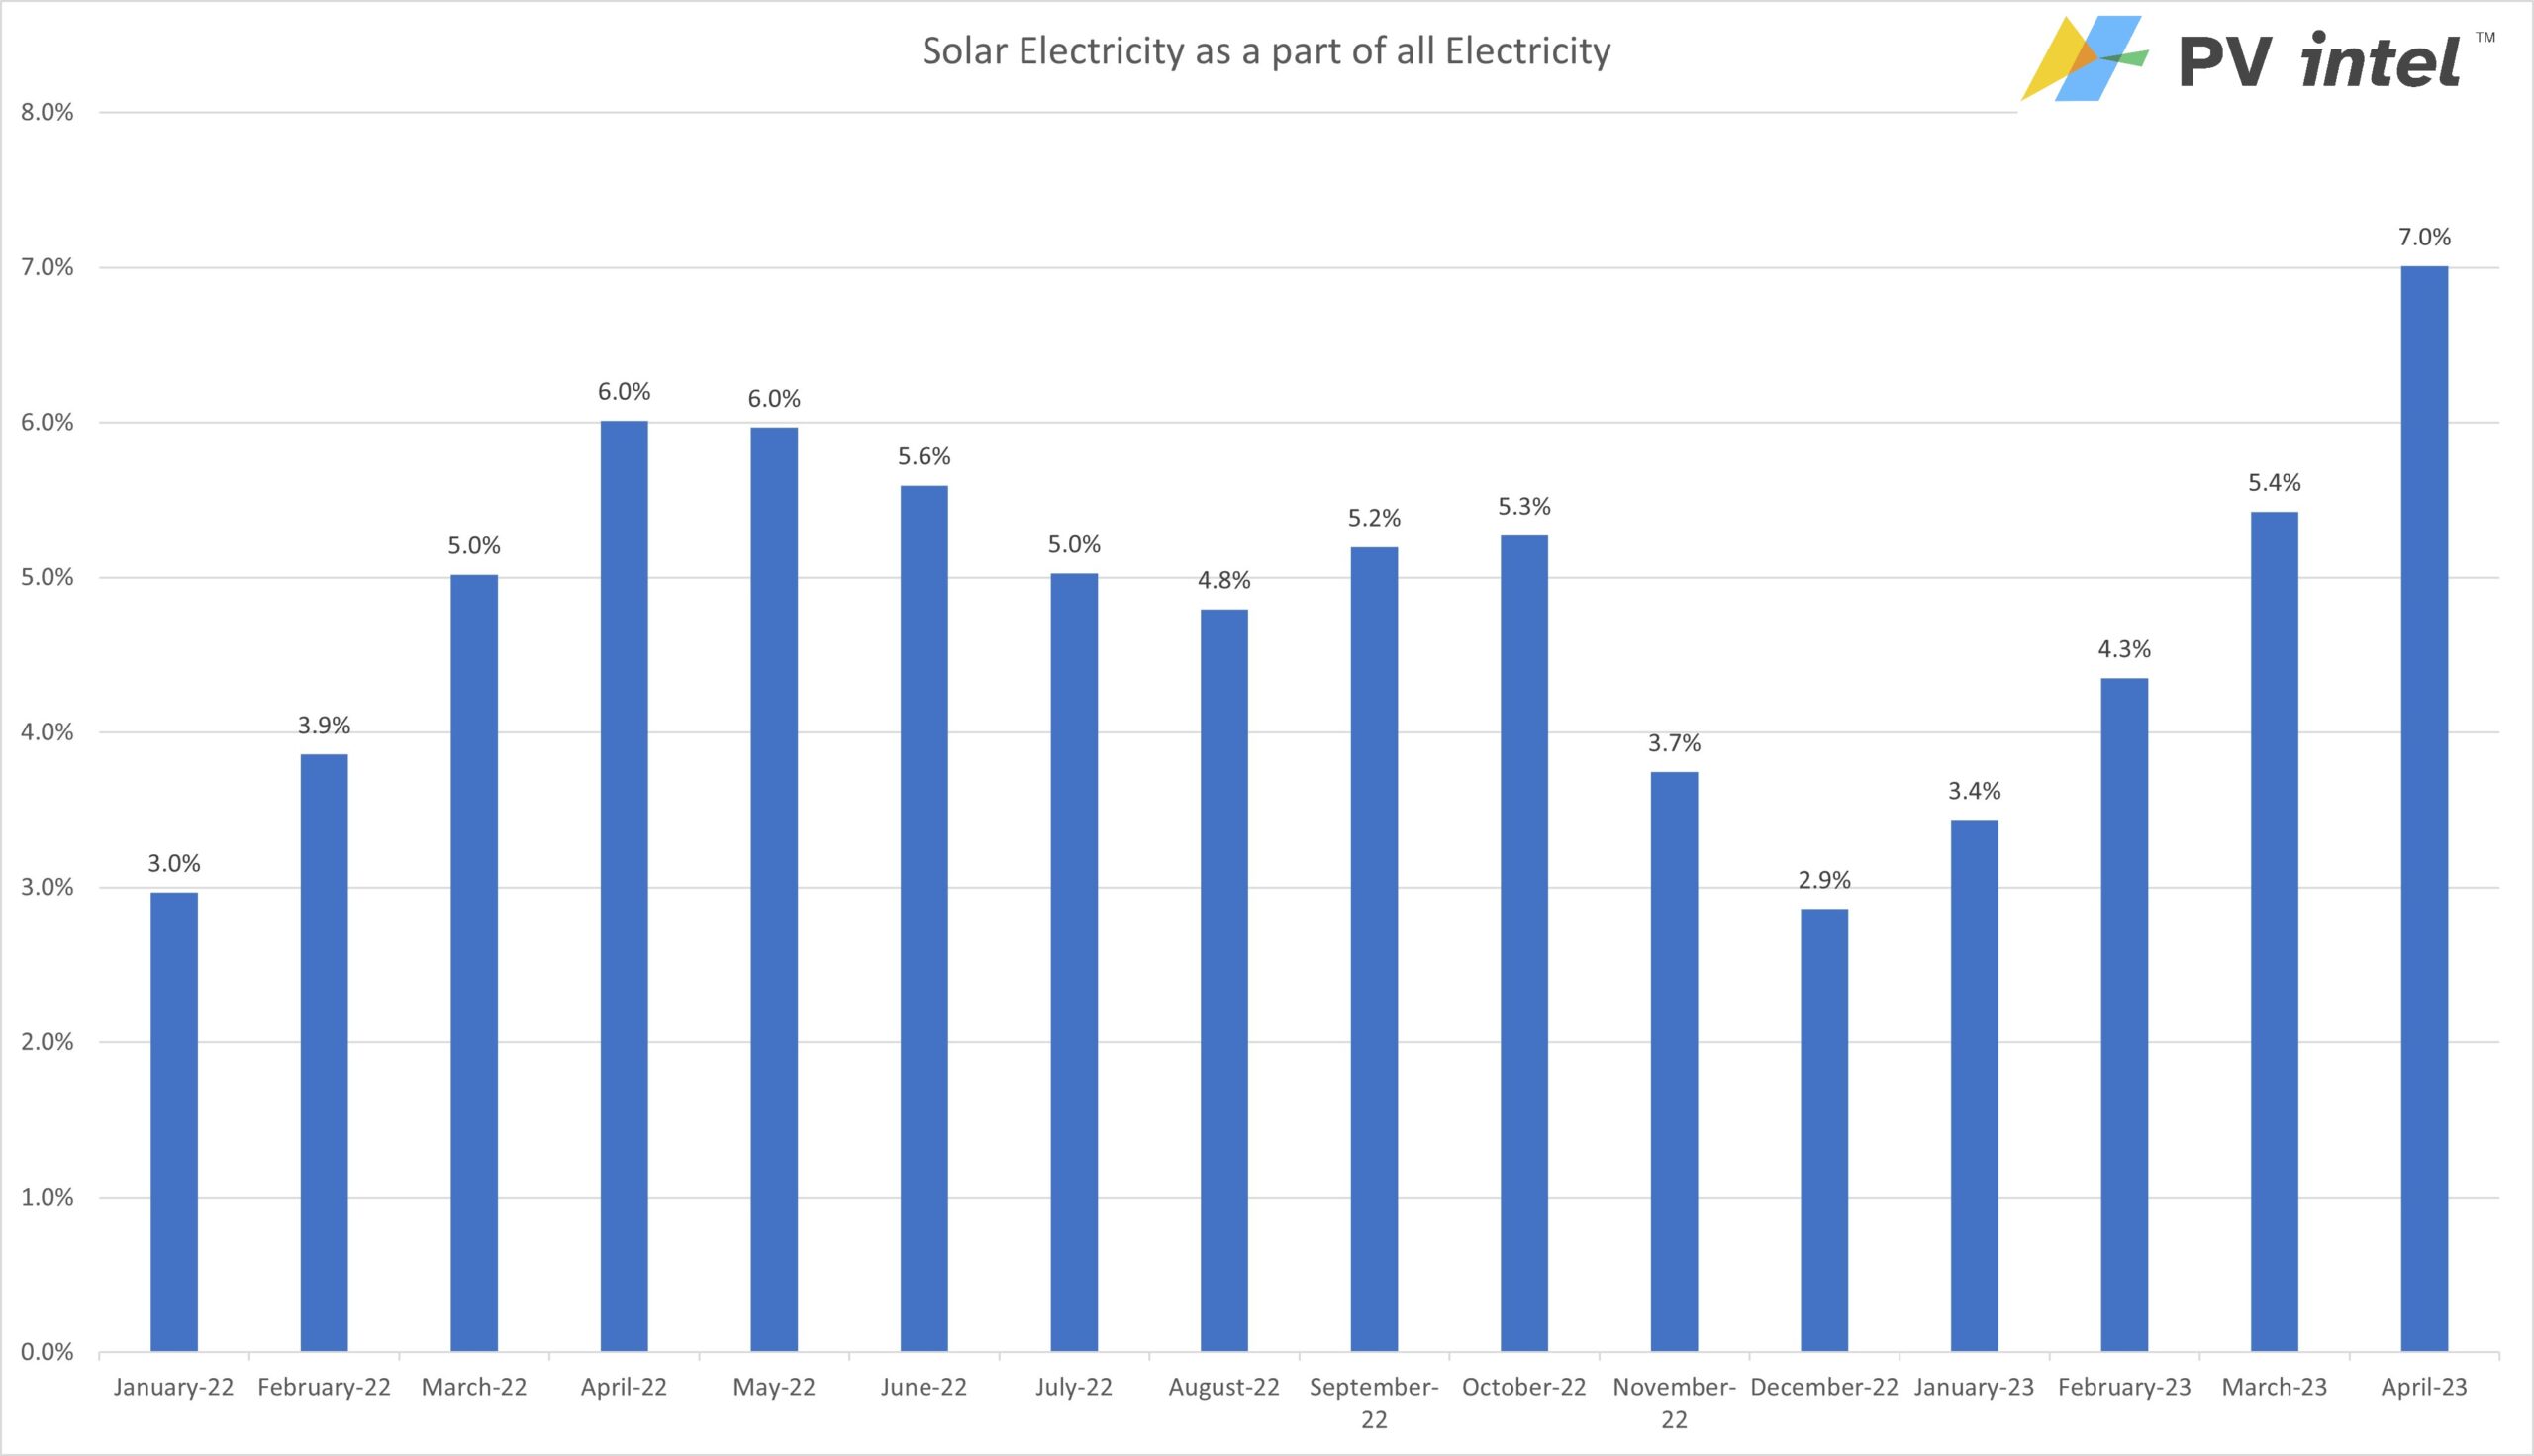
Solar has produced 5% of all electricity so far this year. Comparing data for the whole year through April, solar energy production has seen a 14.2% uptick.
Solar growth rates in 2023 are projected to be less robust than in prior years, due to a decline in total capacity deployment in 2022. Total solar power deployed in 2022 was down 16% versus 2021, at 20.2 GW. With the dip in deployment in 2022, the total installed solar capacity in the U.S. rose to 141 GW by year’s end, as per data from SEIA and Wood Mackenzie Renewables & Power, an increase of just over 16.9%.
For 2023, a significant increase to approximately 30 GW deployed is anticipated, setting a new annual record. This increase would raise the 2022 year-end value to 171 GW, an increase of 21% on the total capacity deployed in the nation. The EIA reports that small-scale solar contributed to 2.2% of all generation in April, while utility-scale generation made up 4.8%. As expected, these percentages vary considerably by state.
Total U.S. electricity consumption for the month – at 278,350 GWh – decreased by 1.9%. Year-to-date, total U.S. electricity usage has declined 2.75% from last year.
In April, wind and solar power combined generated just under 21% of the month’s electricity, marking a modest increase of 0.3% compared to the same period last year. To date, these two renewables have accounted for 17.86% of all electricity generated this year. For wind energy, April’s share in generation mix shows a decrease to just under 14% of all electricity compared to last year’s 14.9%.
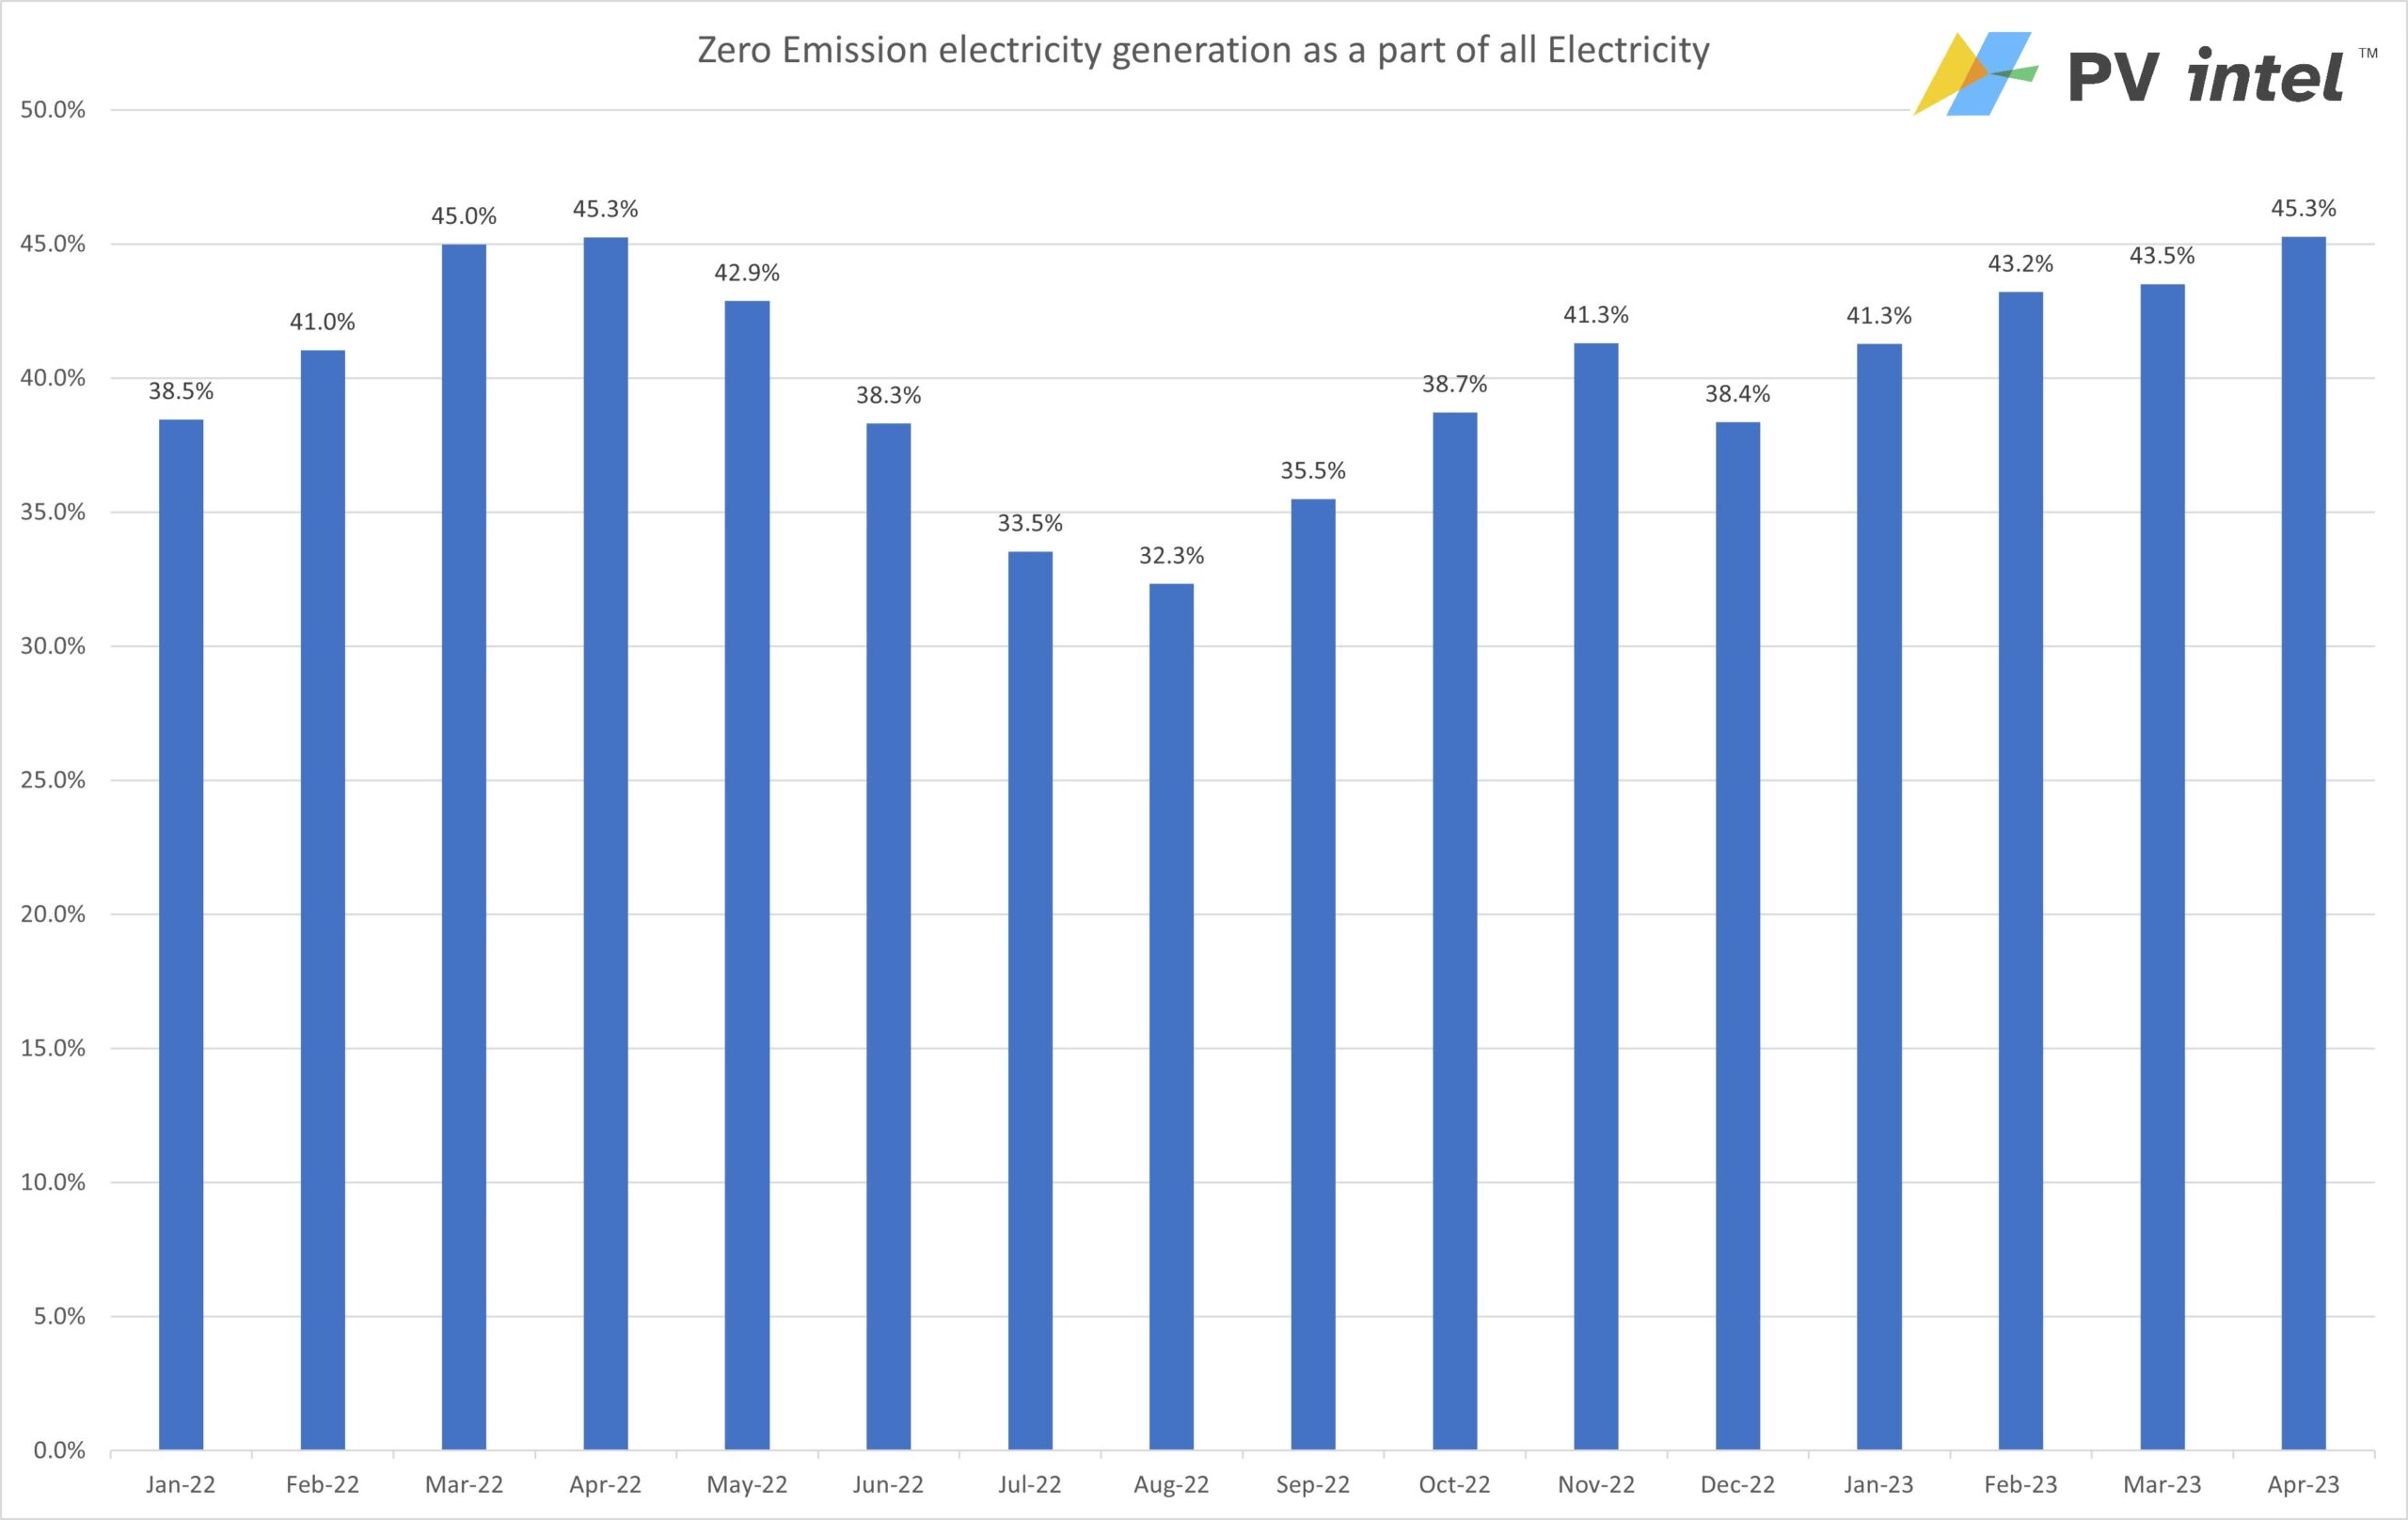
April’s total emission-free generation (comprising nuclear, wind, hydroelectric, solar PV, and solar thermal sources) reached 45.28%. Nuclear power led all emission-free sources, providing 18.39% of all electricity. Wind power contributed 13.95% and hydroelectric made up 5.83%. For the month, total emission-free generation has just barely increased from last year’s 45.27%.
In absolute terms, total emission-free generation for the year-to-date has ]fallen 0.44% from the previous year. So far, emission-free sources have generated 43.3% of all electricity, showing an increase of 2.5% compared to last year’s 42.2%. The reason total emission-free generation increased is because total electricity demand has decreased.
This data was compiled by PV Intel.
This content is protected by copyright and may not be reused. If you want to cooperate with us and would like to reuse some of our content, please contact: editors@pv-magazine.com.


By submitting this form you agree to pv magazine using your data for the purposes of publishing your comment.
Your personal data will only be disclosed or otherwise transmitted to third parties for the purposes of spam filtering or if this is necessary for technical maintenance of the website. Any other transfer to third parties will not take place unless this is justified on the basis of applicable data protection regulations or if pv magazine is legally obliged to do so.
You may revoke this consent at any time with effect for the future, in which case your personal data will be deleted immediately. Otherwise, your data will be deleted if pv magazine has processed your request or the purpose of data storage is fulfilled.
Further information on data privacy can be found in our Data Protection Policy.