Solar energy is now in the center stage of the United States’ plans for a decarbonized economy, representing 70% of high-probability utility-scale power capacity planned through 2025.
Solar’s rise to the top as a key energy resource now seems inevitable, but its fate was not always sealed. The technology contributed a negligible amount of power less than ten years ago, and the Energy Information Administration (EIA) did not begin reporting annual net generation of PV until 2014. In that year, solar contributed 27 TWh of electricity to the U.S. grid. Seven short years later, it generated 164 TWh in 2021, multiplying generation six times over.
The installed capacity of solar has climbed to 77 GW this year, reports EIA, and has 72 GW of high-probability projects queued in late development stages set to come online through 2025. This will effectively double the total installed capacity in three years.
This progress has been made possible by supportive industrial policy, economies of scale, improved technological efficiencies, and business innovations. The levelized cost of electricity (LCOE) has fallen through the years, and the benefits of solar and energy storage become more crystalized as the threats of climate change increase with the passing years.
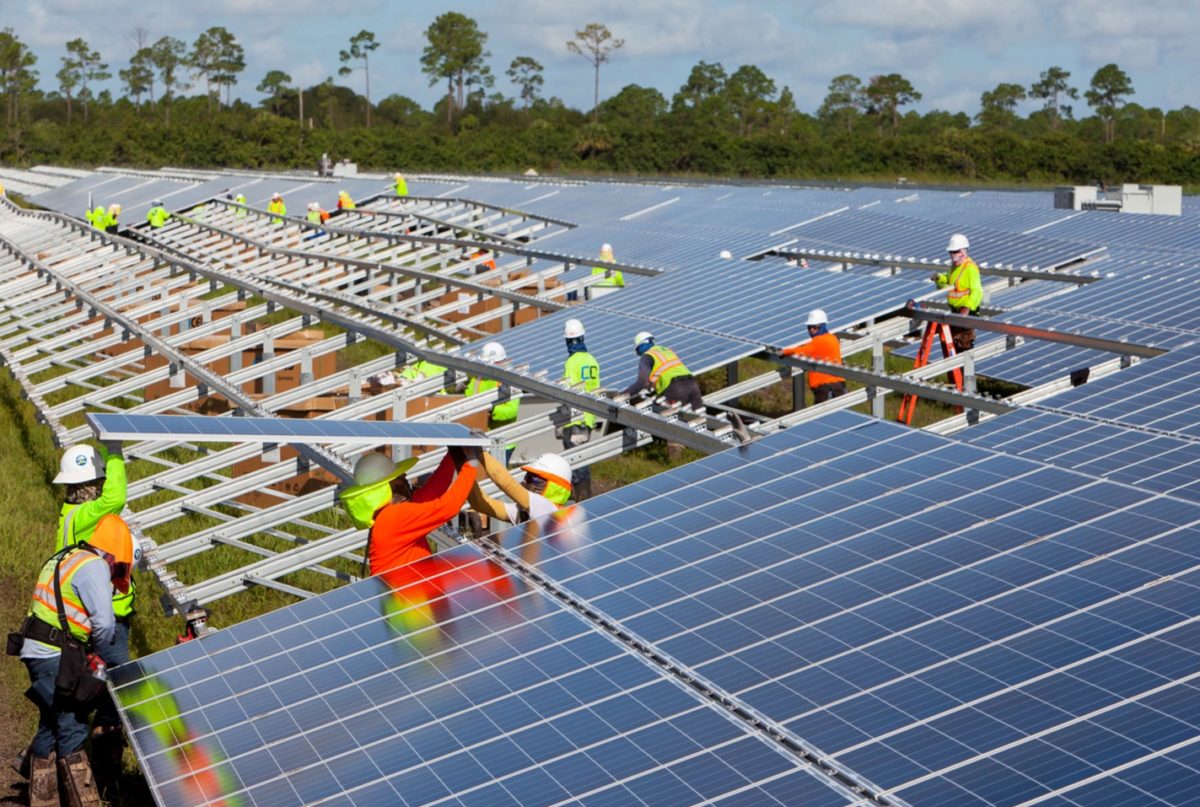
Here are some charts that track the remarkable achievement of the U.S. solar industry, now over 250,000 workers strong, thus far:
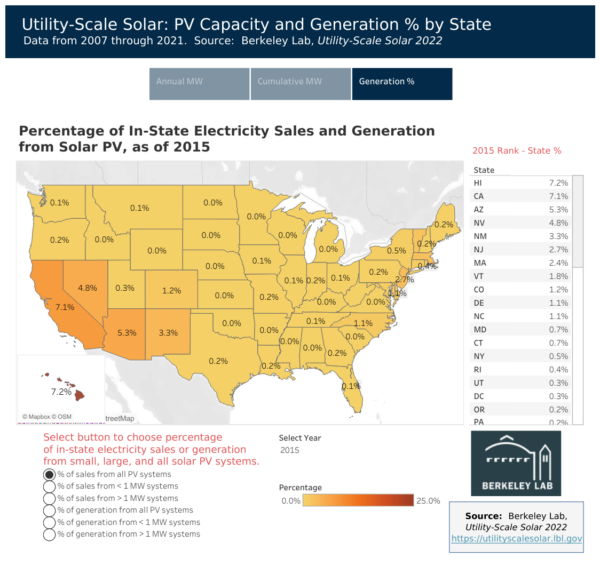
In 2015, solar as a portion of all electricity sales was miniscule in many states, with California and Hawaii leading the way with around a 7% contribution.
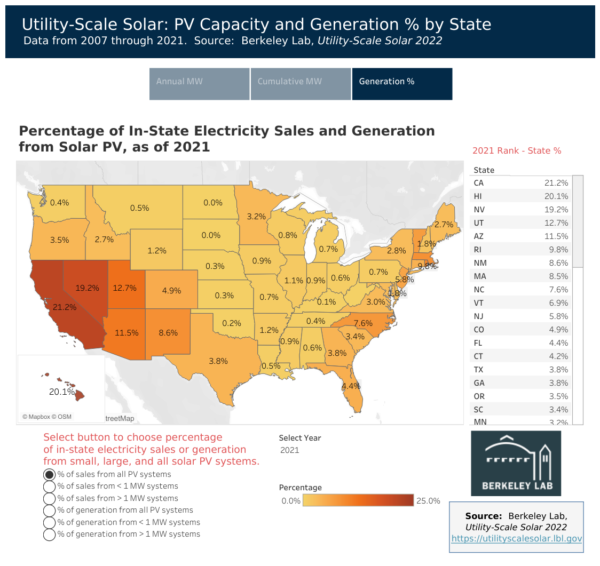
Only six years later in 2021, solar has made its mark in each state in the U.S., and in markets like California, Nevada, and Hawaii, it has achieved about 20% of all energy sales.
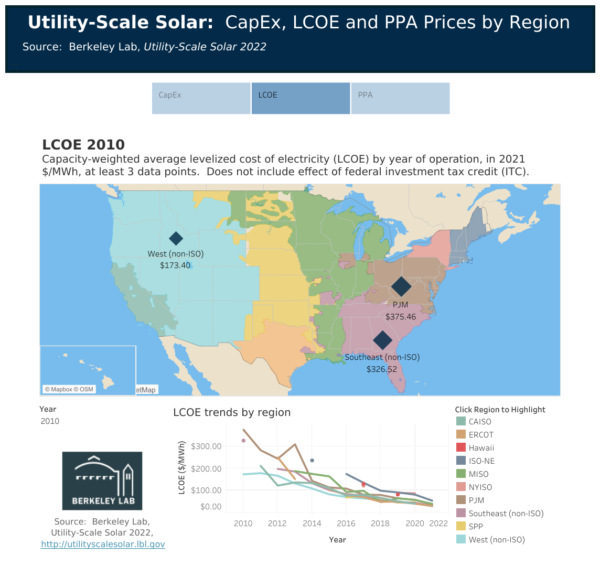
Solar-generated electricity was expensive in 2010. In the West, LCOE was $173 per MWh, and it reached near $400 per MWh in the East.
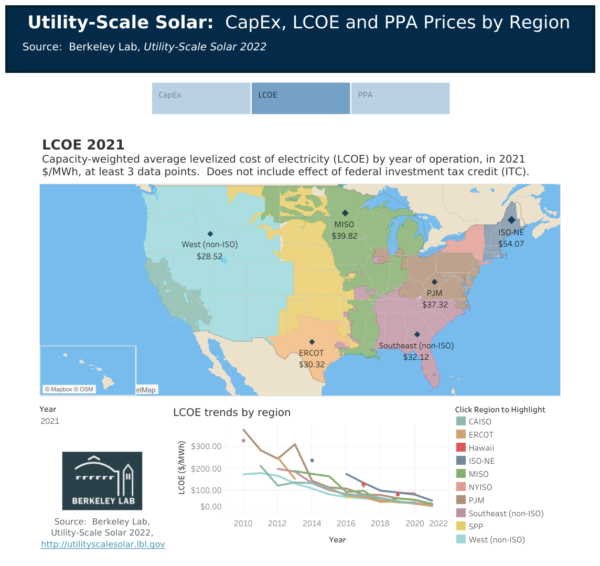
As of 2021, LCOE has fallen precipitously, with costs in PJM nearly one-tenth the cost from 2010, and West projects averaging costs less than $30 per MWh.
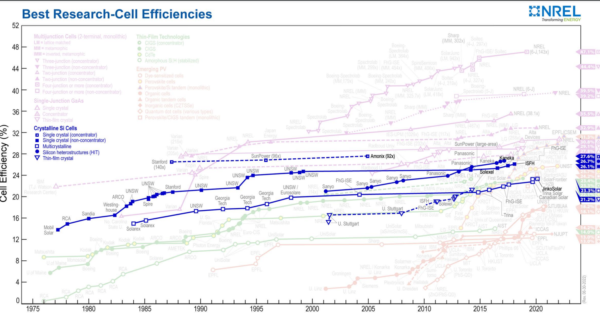
Crystalline silicon solar panels are the most common PV technology used, though there have been promising developments in TOPCon, HJT, perovskites, tandem cells, and other emerging technologies. In the 1970s, solar cells achieved around 15% efficiency. Now, many commercial solar cells range between 21% to 27%, and lab-based emerging technologies have demonstrated efficiencies as high as 47.1%, reaching heights that researchers once thought were impossible.
Looking ahead
The Inflation Reduction Act of 2022 contains $370 billion in spending for renewable energy and climate measures and calls for a 40% reduction in carbon emissions by 2030. Princeton University released a Rapid Energy Policy Evaluation and Analysis Toolkit (REPEAT) in collaboration with Dartmouth College, Evolved Energy Research, and Carbon Impact Consulting, outlining the potential impact of the law.
The impact on the U.S. solar industry could be huge, to say the least. The Princeton report said solar deployment may accelerate from 2020 rates of 10 GW of capacity added per year to nearly five times as much by 2024, adding 49 GW of utility-scale solar each year. Solar deployment may be well over 100 GW per year by 2030, said Princeton.
Investment in solar could reach $321 billion in 2030, nearly double the figure of $177 billion expected under current policy. The Act would lead to nearly $3.5 trillion in cumulative capital investment in new American energy supply through the next decade, said the report.
This content is protected by copyright and may not be reused. If you want to cooperate with us and would like to reuse some of our content, please contact: editors@pv-magazine.com.


As solar grows, preserving non-solar sources that can be scaled back to use less fuel becomes more vital since batteries will not be able to handle large grid loads as efficiently and cost effectively, given their daily recharge cycles and shorter life spans.
Nuclear plants can’t easily throttle to compensate for irregular loads and addition of irregular sources that increases the need for reliable on-line peaker plants when days of dark weather prevent recharging backup batteries.
Huge fuel plants don’t start and stop and throttle like a car. Hope dependable fuel sourced power is properly sustained going forward. Which means much of its operational costs apart from fuel DO NOT GO AWAY when solar meets its growth goals.
Last time I looked, the sun didn’t shine at night, or dark gloomy days, winter snows and adverse atmosphere transmission when weather and occassional volcanoes and wild fires wreak havoc unless well planned for by gov’ts, agencies and utilities they regulate.
I know, LUNAR CELLS are next…LOL…
Most promising option for the required future fraction of 24/7 base load power is Enhanced &/or Advanced Geothermal Systems. Some of these technologies can even be throttled by over pressurizing the wells, storing more heat in the fluid, so they actually provide short-term storage…..a bonus capability for a base load resource. Look up Eavor.com and Quaise.energy.