
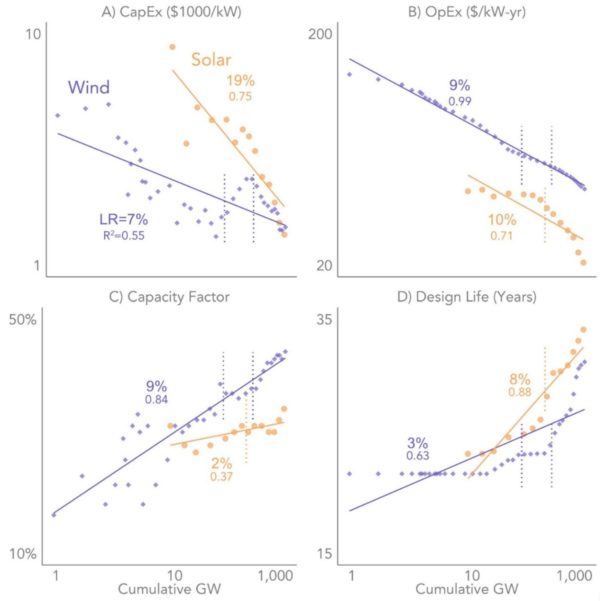
It’s not just the price of solar panels that has fallen, but also the price of inverters, racking, components, and labor per installed watt. In fact, the cost to install utility scale solar has fallen by 19%, as the industry scaled from 10 GW to 1 TW globally.
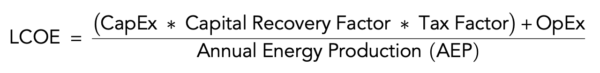
Future costs can be predicted using only hardware and construction prices to estimate projected cost declines, but this data alone is insufficient, as it seems to underestimate learning curves.
Researchers from the Electricity Markets & Policy (EMP) team at the US Department of Energy’s Lawrence Berkeley National Laboratory have released a more refined way to observe – and predict – the price declines associated with learning curves. The key refinement to their learning curve analysis examines a facilities’ broader levelized cost of electricity (LCOE) rather than focusing exclusively on installed costs (CapEx).
Looking at the cost of electricity that a plant makes, along with its construction costs, allows other advancements to be taken into account. For instance, if a power plant lasts longer (say for instance with a 50 year solar panel), the same dollar of installation cost will generate more electricity.
The report authors note that researchers have produced versions similar to these LCOE models before. The EMP team says that their product improves on prior versions by integrating capital expenditures (CapEx), operating expenditures (OpEx), facility capacity factor, the weight average cost of capital (WACC), tax benefits, and plant design into their LCOE calculations.
To develop their models, the EMP team collected data on 822 utility-scale (i.e., ground-mounted and >5 MWAC) PV plants totaling 33.7 GWAC. The plants were built between 2007 and 2020, and represent 87% of total US utility-scale PV capacity operating at the end of 2020. The LCOE was determined on an individual plant basis, accounting for installation year, available sunlight, regional labor costs, changes to borrowing costs, and other factors.
While the research paper doesn’t provide a specific value, the image below does show what the researchers believe the solar learning curve would be with CAPEX costs alone (orange line), versus this document’s LCOE based calculation.
By 2050, the two lines are separated by roughly 24%.
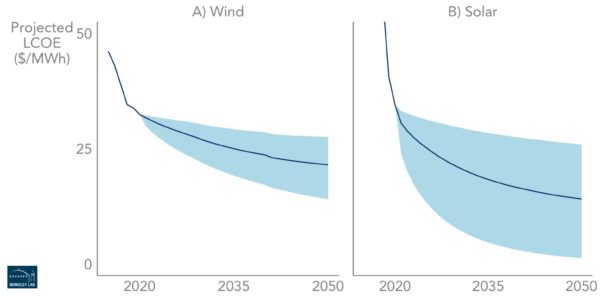
Going forward, this data was used to project solar power’s future pricing declines toward the year 2050. In the next few years, solar’s 24% learning curve cost declines versus wind’s 15% implies that solar should soon be cheaper than wind.
Long term projections suggest that the average cost of solar electricity will be 1.4¢/kWh across the United States. The lower bounds of the nationwide cost of electricity sneaks under 1¢/kWh, with the best sites blowing past the penny barrier.
This content is protected by copyright and may not be reused. If you want to cooperate with us and would like to reuse some of our content, please contact: editors@pv-magazine.com.


By submitting this form you agree to pv magazine using your data for the purposes of publishing your comment.
Your personal data will only be disclosed or otherwise transmitted to third parties for the purposes of spam filtering or if this is necessary for technical maintenance of the website. Any other transfer to third parties will not take place unless this is justified on the basis of applicable data protection regulations or if pv magazine is legally obliged to do so.
You may revoke this consent at any time with effect for the future, in which case your personal data will be deleted immediately. Otherwise, your data will be deleted if pv magazine has processed your request or the purpose of data storage is fulfilled.
Further information on data privacy can be found in our Data Protection Policy.