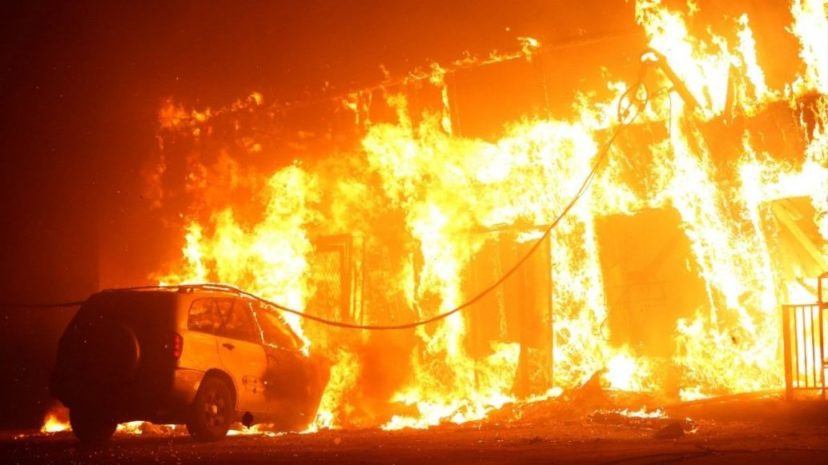
A fire in June at an Amazon warehouse, reportedly caused by a solar system, served as another reminder that the solar industry’s struggle with fire safety isn’t over.
A deeper dive into available data, developed by Dr. John R. Balfour, president of High Performance PV, and Lawrence Shaw, chief solar systems engineer at Higher Powered, LLC, offers a means to estimate the future costs and impacts from reported PV system- sourced fires. Trending this data forward in time demonstrates that the industry should brace for more instances of fire in the future.
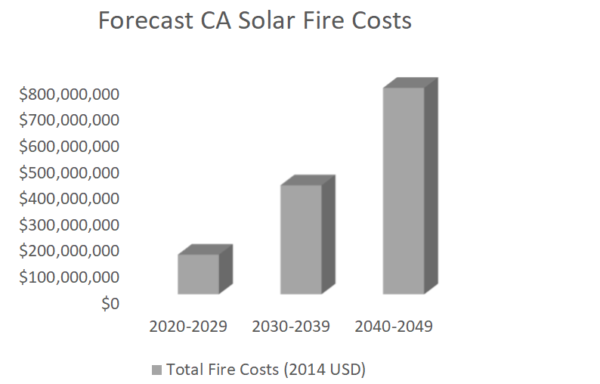
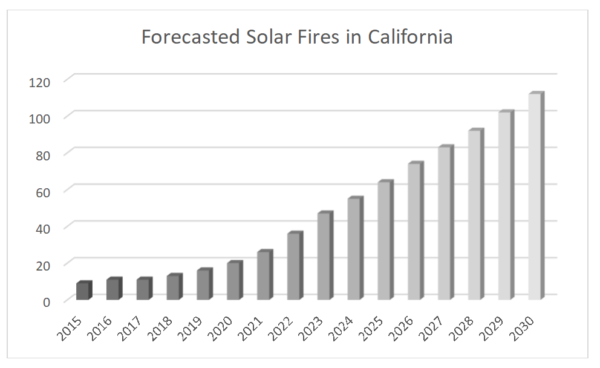
In California, for example, the trend suggests costs exceeding hundreds of millions of dollars, and worse; fires could likely begin injuring people each year starting in 2023. In 2036, the data has led the two researchers to conclude that current practices will lead to loss of life.
The model predicts that by 2025, 64 PV system fires will occur in California, resulting in injury and costs projected to exceed $18 million. In 2030, those number rise to 122 fires, one injury and more than $32 million in damages, and in 2040 the model predicts 238 fires, one death, three injuries, and $68.5 million in damages.
Saying that the best way to solve such a threat is to address it before it becomes one, Shaw and Balfour have worked to compile quantitative data that identifies common failure points in photovoltaic systems.
To date, the majority of data collection efforts have been geared towards understanding issues that may impact system production and, by extension, revenue, and not necessarily failures leading to safety hazards.
Data acquisition systems are hooked up to inverters and are limited in their ability to inform an operator if there is a hotspot in a PV module that has the potential to develop into a thermal event.
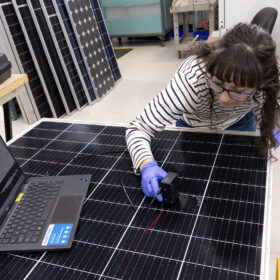
To fully understand the risk of fire and the reliability of equipment, the two assert that routine inspections using infrared imaging must occur, and standardized data must be collected by the maintenance workers in the field as part of the O&M plan.
Supervisory control and data acquisition (SCADA) systems typically aren’t hooked up to PV modules. Because of this, systems often lack the ability to automatically flag safety issues like hotspots to the plant operator.
However, every mobilization is an opportunity for service providers to identify safety and environmental concerns. Maintenance workers typically raise the flag if they see something. Even so, if there isn’t a way to input the data into the operator’s work management tool, then recognizing potential problems will often be overlooked by decision makers.
In essence, a handwritten report does not necessarily mean pertinent information will lead to action.
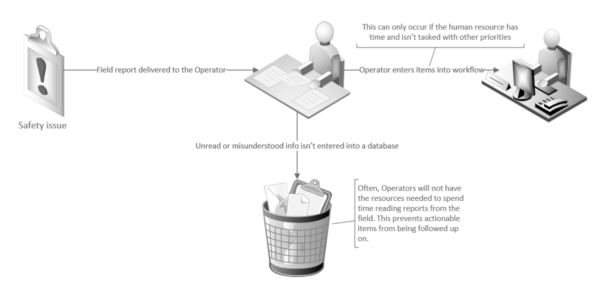
In many cases, third-party maintenance personnel provide the essential information needed to have a feedback loop of information. However, a disconnect may occur when information is not standardized, then entered into a database by the operator. A more effective process may involve standardized nomenclature and digital reporting used by maintenance crews when they are in the field.
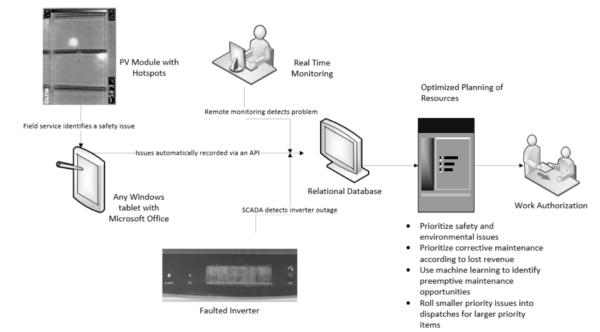
Without a means to include field measurements, decision makers often cannot prioritize safety issues or truly understand equipment reliability. Taking field measurements, then ensuring these observations get recorded into a relational database management system may be an effective means to ensure the system operator can dispatch according to priority and optimize the planning of resources.
Three-step process
Balfour and Shaw implemented a three-step process in their research.
Step 1: determine the number of solar systems in California. To begin the estimate, Balfour and Shaw estimated the population of PV systems in California. The state publicly shares data regarding the number of systems installed each year, their type (for example, utility, commercial, residential), and the overall total number of systems installed.
From this information, the two determined the number of solar systems reported for all independently operated utility companies. For instance, in 2015, they found 144,478 newly installed systems and a total of 425,362 installed systems. Once codified, they used the numbers to represent the overall population of photovoltaic solar systems installed in the state.
Then, using the number of systems installed in California from 1996 through 2019, they forecast the number of systems that will likely be installed in the state in years to come.
Step 2: tally the number of fires for California. Balfour and Shaw then requested historical data provided the U.S. Fire Administration and queried the data to determine the number and locations of photovoltaic sourced fires every year. The two filtered the queried results for photovoltaic sourced fires in California for 2015-2019. This provided them with the number of fires per the number of installed systems in California.
Step 3: Forecast the number of PV system-sourced fires in California. The next step assumed that most photovoltaic solar system fires would be caused by aging system components. This is based on a Japanese case study of 100 solar system fires, which indicated a significant number of failures were attributed to components that were at least seven years old.
For their analysis, Balfour and Shaw assumed most fires would occur in systems at least that old, and adjusted the overall population size accordingly (for example, the number of fires in California in 2015 per number of installed systems in California in 2008). They used that adjustment to estimate the number of fires per number of systems seven years old or older.
The process was repeated for each year from 2015-2019 to establish known values for the independent and dependent variables to forecast the number of California based photovoltaic sourced fires anticipated in the future.
The numbers only contemplated fires where a fire department was dispatched. Balfour and Shaw recognizes that PV-sourced fires aren’t always reported as such, so the two anticipate the actual value to be higher.
To better understand the overall impact, Balfour and Shaw combined the forecasted values with additional fire statistics.
Rate of deaths per fire
Referencing a 2014 report by the National Fire Protection Agency, the two found that there were 3,275 civilian deaths out of 1,298,000 reported fires. As solar fires don’t happen solely at residences, they used the number of deaths per all reported fire types to determine the average number of civilian deaths per fire as follows and arrived at 0.0025 civilian deaths per fire.
When combined with the forecasted number of fires caused by solar systems in California, Balfour and Shaw estimated that PV system fires will lead to loss of life in California every year starting by 2036.
Total cost per fire
From another report provided by the NFPA, the two found more costs associated with a fire than just property losses. The NFPA report provided an aggregate total and breakdown of costs of fires in the U.S. in 2014. Balfour and Shaw used the figure of $328.5 billion (in 2014 dollars) along with the total number of fires in the U.S. in 2014 to determine the average total cost per fire, which they said equalled $287,782 in 2021 dollars.
Some of the details included have been developed for a book titled, Photovoltaic (PV ) System Delivery as Reliable Energy Infrastructure, under contract with John Wiley & Sons. The book is expected to be available in early 2022.
This content is protected by copyright and may not be reused. If you want to cooperate with us and would like to reuse some of our content, please contact: editors@pv-magazine.com.


By submitting this form you agree to pv magazine using your data for the purposes of publishing your comment.
Your personal data will only be disclosed or otherwise transmitted to third parties for the purposes of spam filtering or if this is necessary for technical maintenance of the website. Any other transfer to third parties will not take place unless this is justified on the basis of applicable data protection regulations or if pv magazine is legally obliged to do so.
You may revoke this consent at any time with effect for the future, in which case your personal data will be deleted immediately. Otherwise, your data will be deleted if pv magazine has processed your request or the purpose of data storage is fulfilled.
Further information on data privacy can be found in our Data Protection Policy.