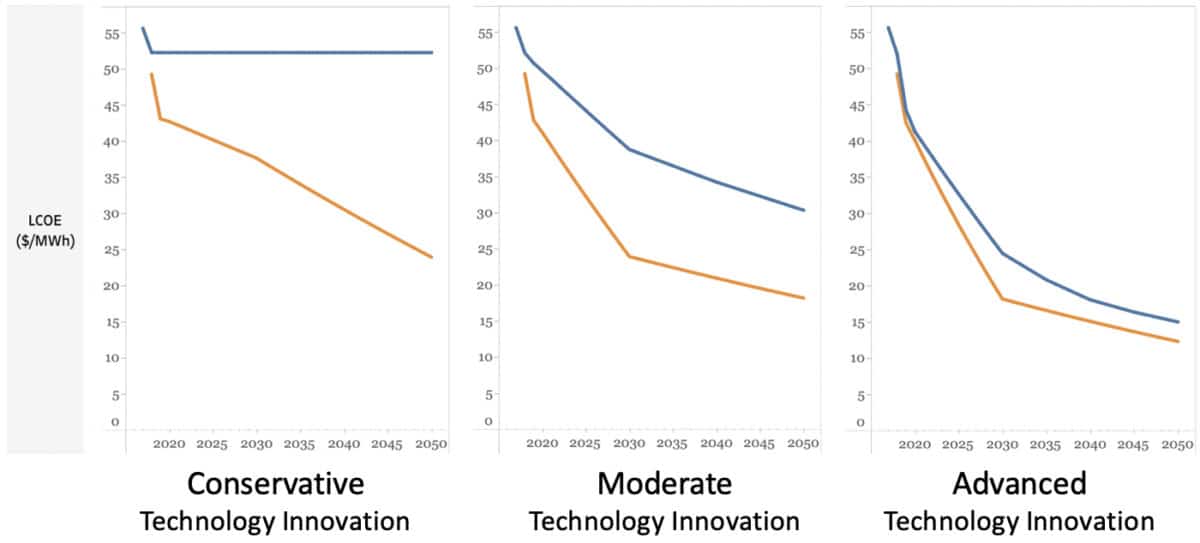
The National Renewable Energy Laboratory’s latest Annual Technology Baseline shows dramatically lower projections for utility-scale PV costs, shown with orange lines in the image above, compared to last year’s projections, shown with blue lines.
NREL developed the new cost curves through a technical-economic analysis using industry projections, said NREL researcher David Feldman in a webinar. NREL’s previous PV cost curves were based on reviews of literature from the previous three years.
The graphs above show the levelized cost of utility-scale PV, for projects entering service through 2050. These specific graphs represent a project in the Kansas City area, assuming NREL’s “R&D” financial case and a 20-year capital recovery period.
NREL has abandoned its constant cost scenario from previous years (blue line at left in image above), after distancing itself from that scenario last year.
At least four utilities used NREL’s constant cost scenario, with its projected high future costs for solar, in their resource planning last year, and as a result, blocked solar from their capacity plans.
The new conservative scenario, even though it represents a slow pace of technology improvements, projects dramatically lower costs for utility-scale PV than last year’s constant-cost scenario.
NREL also forecasts significantly lower costs in the moderate scenario, with a moderate pace of technology improvements (central graph above).
NREL’s advanced scenario (graph at right above) shows that a rapid pace of technological improvements will yield sharp declines in PV costs.
Cost drivers
NREL now projects a faster pace of PV module efficiency improvements than it did in past years, resulting in lower projected capital costs. Here are NREL’s new projections for residential, commercial and utility-scale PV capacity costs through 2050, under the three scenarios, in the Kansas City area:
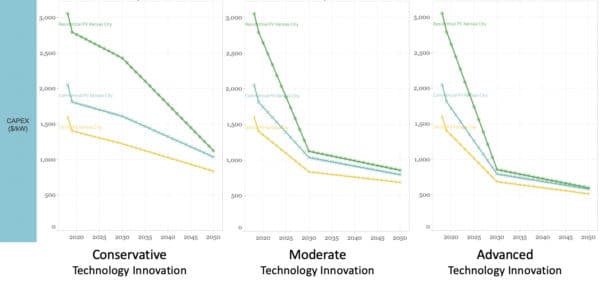
The utility-scale PV capital cost values are shown as the cost per kW-AC, using an inverter loading ratio of 1.34, Feldman said, whereas the residential and commercial values are shown as the cost per kW-DC.
NREL predicts that improvements in four areas will drive PV cost declines: PV module efficiency, inverter power electronics, installation efficiencies, including from the use of higher-wattage panels, and energy yield, due to greater use of single-axis trackers and bifacial modules.
Other factors that are projected to lower costs are declining fixed operation and maintenance costs, permitting improvements, and lower financing costs. For example, NREL’s “R&D” financial case assumes lower financing costs as advances in research and development reduce the perceived risk of PV investments.
Choosing a scenario
Researchers take different approaches to using NREL’s cost projections. For a study on how to achieve lower-cost electricity in the Southeast, Vibrant Clean Energy selected NREL’s 2019 advanced scenario, implicitly assuming that it represented the most likely outcome among the three NREL scenarios.
The “90% renewables by 2035” study by UC Berkeley and GridLab used NREL’s 2019 advanced scenario for costs through 2021, yet for later years the researchers assumed a modest cost reduction trajectory, so they used cost reductions in line with NREL’s mid-case scenario.
NREL has a comprehensive website presenting its approach, methodology and references, to back up its cost projections for solar and other generating technologies. For those who have a question after delving in to the site, NREL provides a contact page.
This content is protected by copyright and may not be reused. If you want to cooperate with us and would like to reuse some of our content, please contact: editors@pv-magazine.com.


Wonder if someone is going to retire so posted closer to real projections instead of the flat-line bs from years past.