Utility-scale PV beginning commercial operation in 2020-2021 could cost an average of only $22/MWh on a capacity-weighted basis. That’s the average price for power purchase agreements executed in 2018, and there’s typically a 2-3 year lag until start of operations. That 54% cost decline since 2017 represents good news from the Annual Technology Baseline published by the National Renewable Energy Laboratory (NREL).
Looking to 2030 and beyond, NREL sees cost reduction potential from cell efficiency gains—reaching 22-24% by 2021, as announced by Canadian Solar, for example—and points to the 44% theoretical maximum efficiency of double junction cells using perovskite on top of crystalline silicon. NREL also notes pathways to achieve lower costs for inverters, labor, and racking.
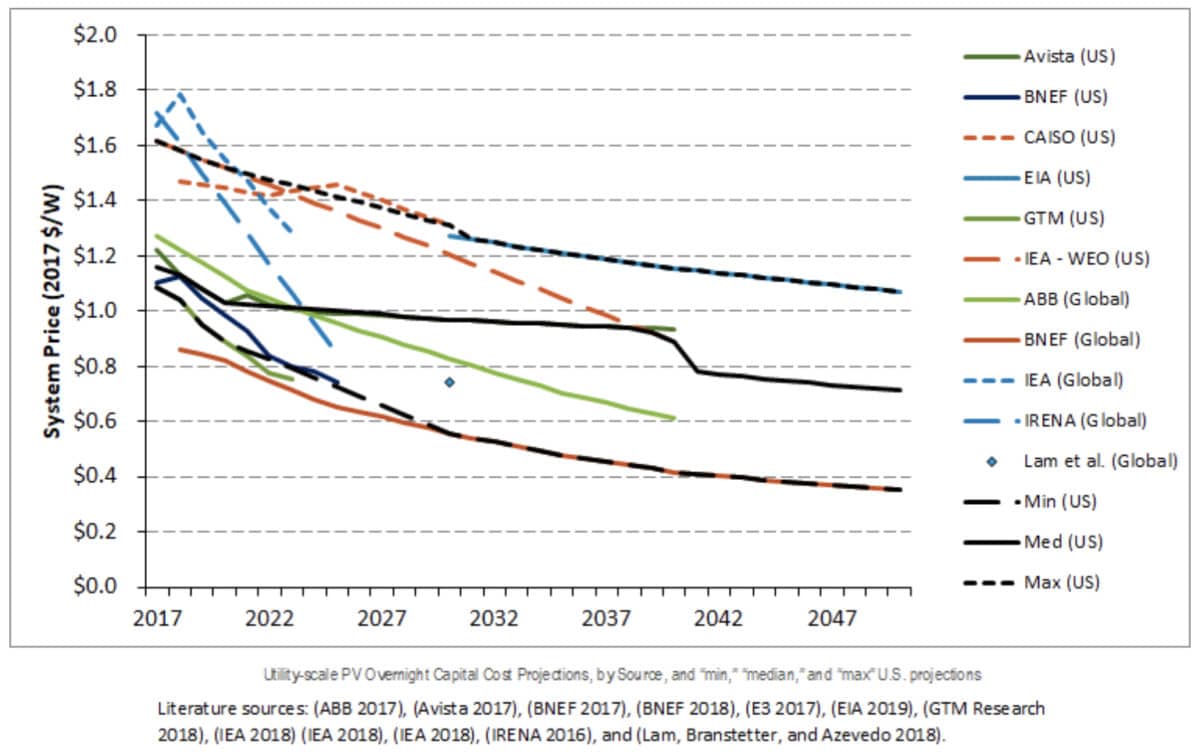
Yet that good news is deep in the report, and is overshadowed by a prominently placed graph (below). The graph is mostly based on data, showing “mid” and “low” cost scenarios that NREL compiled based on 11 studies (shown in the featured image for this story), and projecting steady PV cost reductions. But the graph also shows, hovering above, a higher “constant” cost scenario (dashed orange line in the graph below), based on tradition, not data, and showing solar prices staying constant from 2018 through 2050.
The “constant” cost scenario may embolden fossil-favoring utilities to assume high (constant) costs for solar when running their resource models, which would result in low amounts of solar in their plans. The Tennessee Valley Authority made just that assumption earlier this year, as did Dominion Virginia.
“NREL does not think that PV pricing will remain constant in the future,” explained NREL Senior Financial Analyst David Feldman in a pv magazine interview. “The constant scenario is something we have for all technologies and lets us look at how the U.S. electric market would evolve if we hold today’s values the same.” He said that for utility resource planning, either the low or mid case should be used, “depending on a person’s view of the likelihood of PV achieving its R&D and market efficiency goals for the future.”
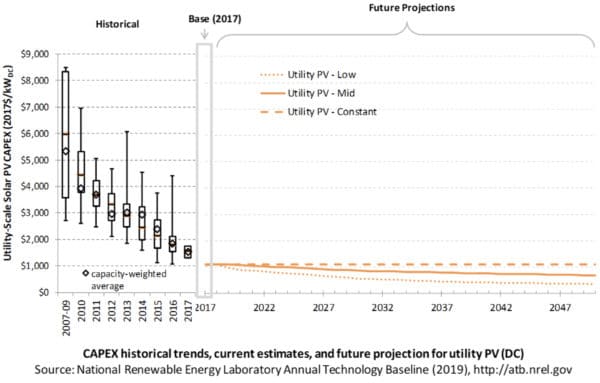
As early as 2020, a substantial discrepancy opens up between the “constant” scenario capital costs for utility-scale PV, pegged at $1,115 per kW-DC, and the “low” costs of $902 per kW-DC, as shown in the chart below, from the Annual Technology Baseline data file. By 2030, the “mid” costs are projected at $862, and the “low” costs at $565–while the constant costs don’t budge from $1,115. (NREL also projected operating and maintenance costs, and PV degradation rates.)
And even NREL’s mid-case projections for solar costs “have historically underestimated real-world cost declines,” according to Energy and Environmental Economics Senior Partner Arne Olson, in testimony for the Georgia Large Scale Solar Association in a Georgia proceeding (docket number 42310).
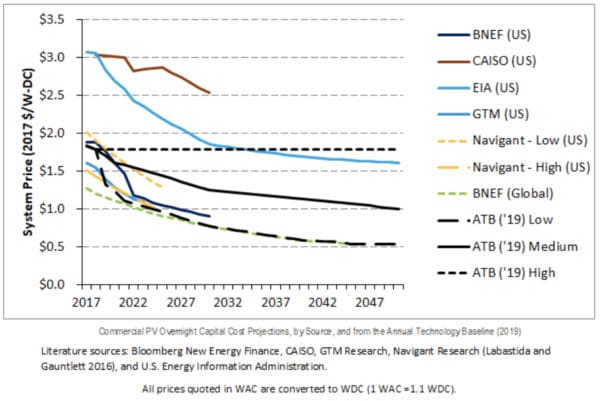
Cost forecasts for commercial and residential PV
NREL provided the following graph showing projected capital costs for commercial PV, including its own projections marked “ATB” (for “Annual Technology Baseline”).
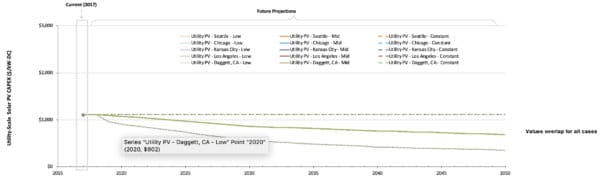
For residential PV capital costs, NREL compiled the following projections:
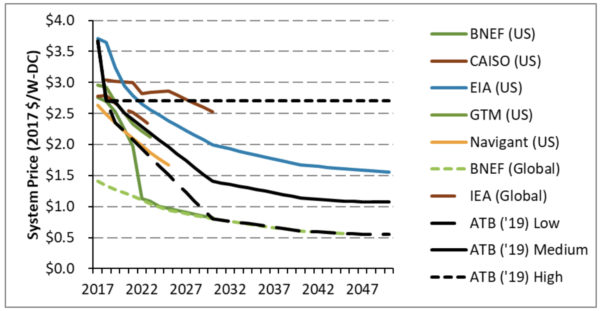
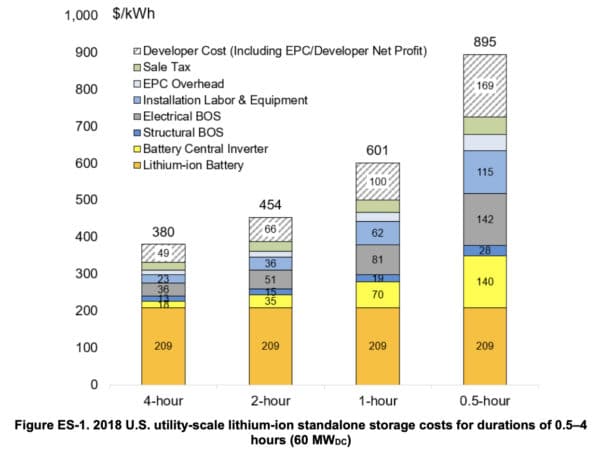
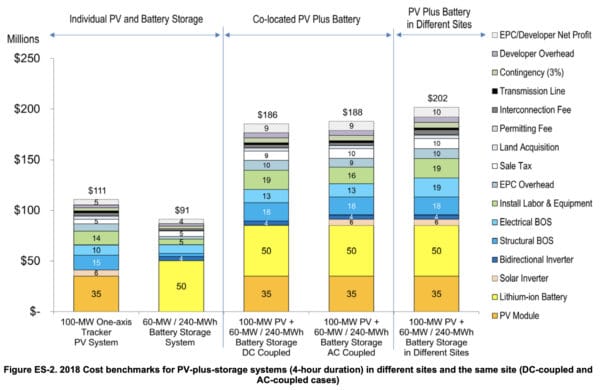
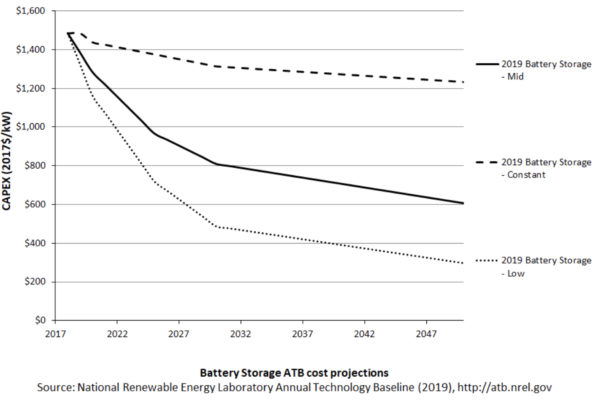
Battery storage cost analysis
NREL’s report provides three charts on battery storage costs, all drawn from previous NREL studies. The first chart shows the cost advantage of longer-duration batteries:
The second shows the cost synergies of co-locating solar with storage:
And the third shows a range of battery cost projections:
NREL notes that it uses a representative value of 85% round trip efficiency for battery storage.
This content is protected by copyright and may not be reused. If you want to cooperate with us and would like to reuse some of our content, please contact: editors@pv-magazine.com.


By submitting this form you agree to pv magazine using your data for the purposes of publishing your comment.
Your personal data will only be disclosed or otherwise transmitted to third parties for the purposes of spam filtering or if this is necessary for technical maintenance of the website. Any other transfer to third parties will not take place unless this is justified on the basis of applicable data protection regulations or if pv magazine is legally obliged to do so.
You may revoke this consent at any time with effect for the future, in which case your personal data will be deleted immediately. Otherwise, your data will be deleted if pv magazine has processed your request or the purpose of data storage is fulfilled.
Further information on data privacy can be found in our Data Protection Policy.