The Covid-19 pandemic has the world in an economic meltdown. The lockdown in many countries is affecting trade and business and is directly impacting the global economy. However, this effect on our economic activities has brought some good news regarding our environmental footprint on the planet. The U.S. and China show a temporary decrease in air pollution, as there is less road and air traffic and less businesses running. China’s coal use has plummeted 36% compared to the same period last year. There is a significant decrease in emissions such as nitrous oxides and particulate matter 2.5.
This shows that our economic activities are linked to global warming to a dangerous extent. The current situation provides hope that, under more determined actions, we can restrict global warming as per our targets. We need to decouple our economic activities from their impact on the environment and their contribution to global warming.
The urgency to curb global warming has only increased over the last years. As per IRENA’s 2018 Global Energy Transformation report, in light of current measures and policies, global Green House Gas (GHG) emissions are expected to reach an annual emission number of 34.8 Gt/year – with a global rise in temperature between 2.6°C and 3.0°C.
In 2017, 41.4% of the world’s GHG emissions came from the power and heat sector, as per International Energy Agency. The world’s primary energy supply is expected to increase by almost 40% by the year 2050, due to emerging economics in the global South, population growth, increased industrialization, and technological advancements.
To meet these demands and to convert the existing energy supply infrastructure to clean and renewable sources, the share of electricity in total final energy consumption would need to double until 2050 as to what it was in 2015. This means that energy services such as cooking, transport, and heating & cooling need to be electrified as well. This puts up a huge challenge for renewable energy technologies to be deployed in vast numbers to not only replace the existing, conventional, fleet of fossil fuel based power generators, but also to suffice the increasing energy demands.
Renewable energy technologies and life cycle analysis
Today, the Variable Renewable Energy (VRE) technologies, primarily wind and solar PV, have established themselves as economical and have proven to be cheaper than conventional power generators in many markets. The Levelized Cost of Electricity (LCOE) for these technologies have seen a steep decline over the past decade and more is expected to come as these technologies mature. In 2018, IRENA predicted a total installed capacity of 7.5 TW for solar PV would be needed for a 66% probability to lower emissions and keep the global rise of temperature less than 2°C above the pre-industrialized levels.
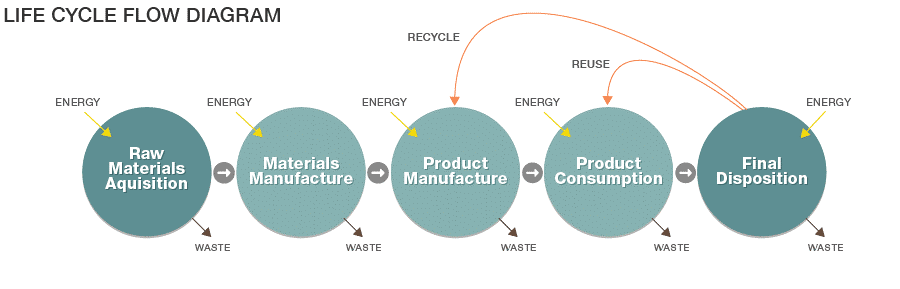
When solar PV deployment is anticipated in such huge numbers and to be an incumbent in the future energy mix, it is of paramount importance to assess the different solar PV module technologies from a life cycle perspective, rather than only evaluating only the operational phase for their impact on the environment. Life Cycle Assessment (LCA) provides a concrete and quantified analysis of environmental impact through a cradle to grave approach. Figure 1 displays the different stages in the life cycle; extraction of raw materials, product/component formation, transport, system integration, operation, removal and disposal and, if applicable, recycling of a product or a system, providing a concrete understanding of the analysis.
Different solar cell technologies can be broken down into generations.
- 1st Generation: Crystalline silicon and gallium arsenide solar cells
- 2nd Generation: Thin-film copper indium (gallium) selenide, cadmium telluride & amorphous silicon
- 3rd Generation: Multi-junction, dye-sensitized, and perovskite solar cells with more technologies in development
The current global deployment of solar PV, as per a REN 21 report, reached 505 GW at the end of 2018. Fraunhofer estimated 60.8% was multi-crystalline Silicon, 32.2% was mono-crystalline silicon, and 4.5% was thin film solar in 2017. Among thin film technologies, 2.3% of global PV production was cadmium telluride (CdTe), 1.9% was CI(G)S and 0.3% was amorphous-silicon. In 2017 the global market share for PV production was dominated by China and Taiwan with 70%, while Asia-Pacific and Central-Asia held 14.8% and Europe and the U.S. contributed with 3.1% and 3.7%, respectively.
Three photovoltaic technologies
For the context of this article, three dominant technologies are discussed: multi-crystalline silicon, mono-crystalline silicon, and thin film cadmium telluride (CdTe).
The following chart shows the LCA-based mid-point indicators of global warming potential, measured as the sum of Greenhouse Gas (GHG) emissions and cumulative energy demand throughout the life cycles. The data is shown for 10 MW PV plants in Munich, Germany for each of three chosen PV module technologies with similar module efficiencies.
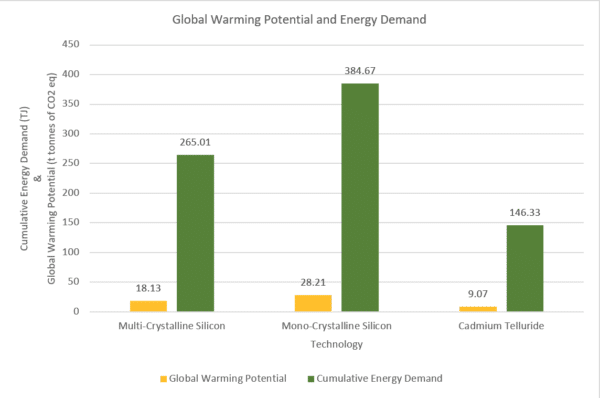
The cumulative energy demand indicator refers to the amount of energy required throughout the life cycle of the PV plant: extraction of raw materials, manufacturing the components involved, construction of the plant, operational life and decommissioning and deconstruction. The global warming potential indicator refers to the total sum of green house gas (GHG) emissions, in thousand ton of CO2 equivalent, throughout the life cycle of the PV plant.
The 10 MW mono-crystalline silicon plant in Munich has the highest cumulative energy demand, surpassing the other two technologies and reaching 384.67 TJ throughout the life cycle. This due to the relatively energy-intensive supply chains in manufacturing mono-crystalline silicon solar cells and modules. The 10 MW multi-crystalline silicon stands next in energy consumption of 265.01 TJ and the 10 MW CdTe PV plant consumes the least at 146.33 TJ, throughout the life cycle.
The energy demand also drives the life cycle emissions for the PV plants of each of the three technologies. It is important to note here that the life cycle inventory used to perform the life cycle assessment for all the three technologies of the PV plants is based on the IEA Task 12 life cycle inventory and ecoinvent v2.2+.
The supply chains for crystalline silicon are representative of the world’s average share of PV module production which is coal dominant, a 64% share. The power grid in China is coal dominant which has a higher environmental footprint, emitting not only CO2 emissions, but also particulate matter 2.5/10, sulfur dioxide, and nitrogenous oxides.
The CdTe PV module production supply chain is primarily based in USA, Malaysia, and Germany, as per the IEA Task 12 life cycle inventory. In addition, CdTe being a thin film technology, second generation solar cells, uses much less material and energy, as compared to crystalline silicon technology; depositing a very thin layer of PV cells on the glass instead of developing a wafer cell. Less energy usage also contributes to lower lifetime GHG emissions.
This rationale forms the very basis for the 10 MW mono-crystalline silicon PV plant having the most life cycle GHG emissions among the three technologies, about 28.21 thousand tons of CO2 equivalent. Followed by multi-crystalline silicon, 18.13 thousand tons of CO2 equivalent, and then CdTe, 9.07 thousand tons of CO2 equivalent.
GHG emissions
The below figure shows the GHG emission factors calculated by dividing the lifetime emissions by the lifetime electrical energy production of the specific 10 MW PV plants. Climate Change Impact Mitigation Potential (CCIMP) refers to the potential of each of the three 10 MW PV plants to eradicate the average emissions that are a result of producing electrical energy for the national grid. The CCIMP is calculated against the local power grid of Germany. Each kWh produced by the PV plant is replaced by the kWh produced by the power grid. The average GHG emissions per kWh produced by the grid (Grid GHG emission factor) is taken from IEA PVPS Task 12 life cycle inventory. The CCIMP is calculated by deducting the PV GHG emission factor from the power grid GHG emissions factor. The resulting emissions per kWh are the ones that are prevented from being produced.
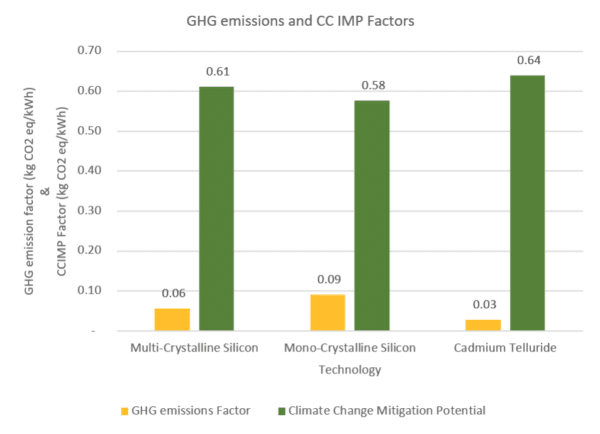
CdTe has the lowest emissions factor owing to the lowest lifetime emissions and higher energy yield due to better high temperature performance and spectral response. This also results in the technology having the highest CCIMP. Mono-crystalline silicon has the highest emissions and the lowest energy yield, owing to worse high temperature performance which results in highest emission factor and lowest CCIMP factor. To put PV into perspective, on a holistic level, the life cycle based GHG emissions factor for a pulverized coal power plant is 0.933 kg CO2 eq/kWh. This is about 10 times more than the highest GHG emissions factor of mono-crystalline silicon and about 30 times more than the lowest GHG emissions factor of the CdTe PV plant.
The figure below shows the energy payback time (EPBT) and energy return on investment (EROI) for the three plants. The energy payback time refers to the breakeven point in time (years) where the cumulative energy demand equals the electrical energy produced by the PV plant. The energy return on investment refers to the “profitability” of the electrical energy production by the PV plants. The EROI is calculated by dividing the lifetime electrical energy produced by the PV plant by the lifetime energy invested in the PV plant. This indicator allows analysis on basis of how much energy intensive is the technology and how much energy profitable is the technology.

The CdTe 10 MW PV plant being the least energy intensive and having the most yield over its lifetime has the quickest energy payback time of only 1.15 years and the most energy return on investment of 26.13. While mono-crystalline silicon has the highest energy payback time among the three technologies at 3.18 years and owing its lowest yield, it has the least energy return on investment of 9.43.
The results and interpretation of the life cycle assessment for the three market dominant PV module technologies points out that thin film CdTe surpasses the crystalline silicon PV module technologies in terms of sustainability and yield performance.
Solar PV was been the fastest growing industry over the last decade, with a compound annual growth rate of 36.8% from 2010 to 2018. Solar PV modules have improved a great deal as a product – better performance due to improved efficiencies, power temperature coefficients and better spectral responses. Better power electronics enabled safer, more reliable operation and grid integration. Improved solutions for balance of system and better understanding of PV operation – learning from global experience – improved performance ratios. Business models such as power purchase agreements, leasing and crowd funding improved and made financing more practical. These advancements allowed an exponential fall in PV costs over the last decade which led to an increased demand and massive industrialization.
The following chart displays the cost learning curve for solar PV systems.
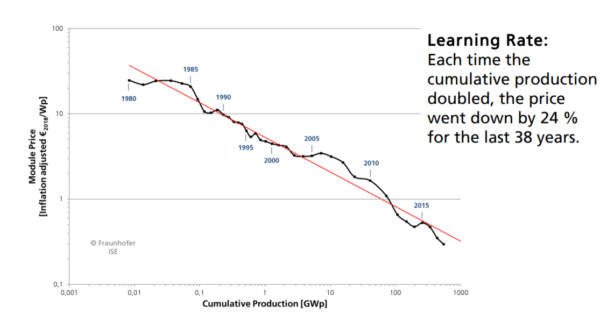
The LCOEs of solar PV systems lie between $.039 to $.13/kWh in Europe (GHI ~ 950 to 1300 kWh/m2). IRENA predicts a 59% decrease in PV investment costs price by 2025.
With a more sustainable life cycle and better field performance, thin film technologies are expected to increase in share of the global market and are to play a significant role in the global energy transition.
***
Jahanzeb Tariq is a renewable energy professional with expertise in solar photovoltaics, energy storage, micro-grids, grid integration of VRE, electricity markets and environmental economics. Jahanzeb has worked in the industry as an engineer, consultant and analyst and carries an engineering bachelors in engineering sciences and a masters degree in energy and environmental management.
This article is based on master thesis research here.
The views and opinions expressed in this article are the author’s own, and do not necessarily reflect those held by pv magazine.
This content is protected by copyright and may not be reused. If you want to cooperate with us and would like to reuse some of our content, please contact: editors@pv-magazine.com.


The quantitative conclusions of this study are rendered doubtful by the choice of representative module technologies. According to table 8.4, this study uses a 2017 cadmium telluride module from First Solar, a 2015 mulitcrystalline silicon module from Jinko Solar, and a 2014 monocrystalline silicon module from Suntech. Each module had a nominal STC efficiency of 16.70%.
However, best-of-breed monocrystalline silicon modules have consistently demonstrated higher efficiency than the best multicrystalline silicon modules, which in turn have remained ahead of the best cadmium telluride modules. This thesis was completed in 2019. Its use of numbers from 2014 to represent silicon modules puts it woefully out of date; this spans an era of aggressive introduction of PERC technologies for both mono- and multi- silicon modules.
I would expect cadmium telluride technology to maintain its first-place ranking in a corrected study; CdTe technology does use appealingly little energy in its manufacturing phase. However, I would expect that the quantitative gap between all three technologies would be smaller if the study were corrected to use the best present commercial offering in each class.
A lot of these studies are biased towards the utility scale model of “economies of scale”. Yet after the solar PV farm or wind farm out in the middle of no where’s generated power is put onto the grid, it still goes through the transformer step process that is inefficient. It will always be more efficient to install the solar PV generation on the roof of the building that will use the power and if the system is “overdesigned”, the excess power generated should also be “stored for later use” where the solar PV is installed. In the utility industry, adding panels that are a few cents per watt does not create a problem most of the time at this scale. So, for utility scale operations cost per watt installed is reduced by sheer numbers of panels deployed rather than something like a residential application where the First Solar 25 square foot 445 watt series 6 solar PV panels wouldn’t work as well on the roof of a home. The shot in the arm for residential and small business applications would be the “tandem” cell technology panels that would allow a smaller foot print for rooftop installations and the solar harvest efficiency of around 35% that would allow a 400 square foot solar PV array on a roof to provide from 37kWp STP to around 29.5kWp PTC. When this technology point is reached, the home owner using larger ESS units that could provide “on average” three days energy needs to the home or business would be in the 150kWh range could accommodate the home’s energy needs for 24 hours, “most” of the time. Not off grid but could be used for extended periods of no power to power critical loads in the home. Technology is moving towards higher efficiency power drivers for inverters, that can handle higher loads and higher temperatures in smaller packages that will create the home primary power supply and use the grid through the ESS as a backup energy source (if) needed. The smart hybrid inverter of 25 to 35kW would service most homes power needs. Get that generation and daily storage out to 16 to 20 hours a day and electric utilities will have to find a different business model of distributed generation with aggregate energy storage of perhaps gigawatts in particular service areas.
FINEST EXPLANATION I EVER SEEN THANKS.