Utility-scale solar power purchase agreement (PPA) pricing fell by 4.7% in 2019 – settling in at an average of 2.74¢/kWh, according to LevelTen Energy.
 PJM Interconnection was the only region to see a rise in pricing quarter-over-quarter in Q4 — with a 2.6% increase. MISO saw the greatest quarterly decline at 4.3%, while CAISO, SPP and ERCOT each had a ~1% price decline compared to Q3.
Wind and solar PPA pricing saw a slight average decrease among the 609 price offers at 360 individual projects, even with wind PPAs increasing by a small bit. The average solar project was 127 MWac and the term length for solar power projects was stable at an average of 13.9 years.
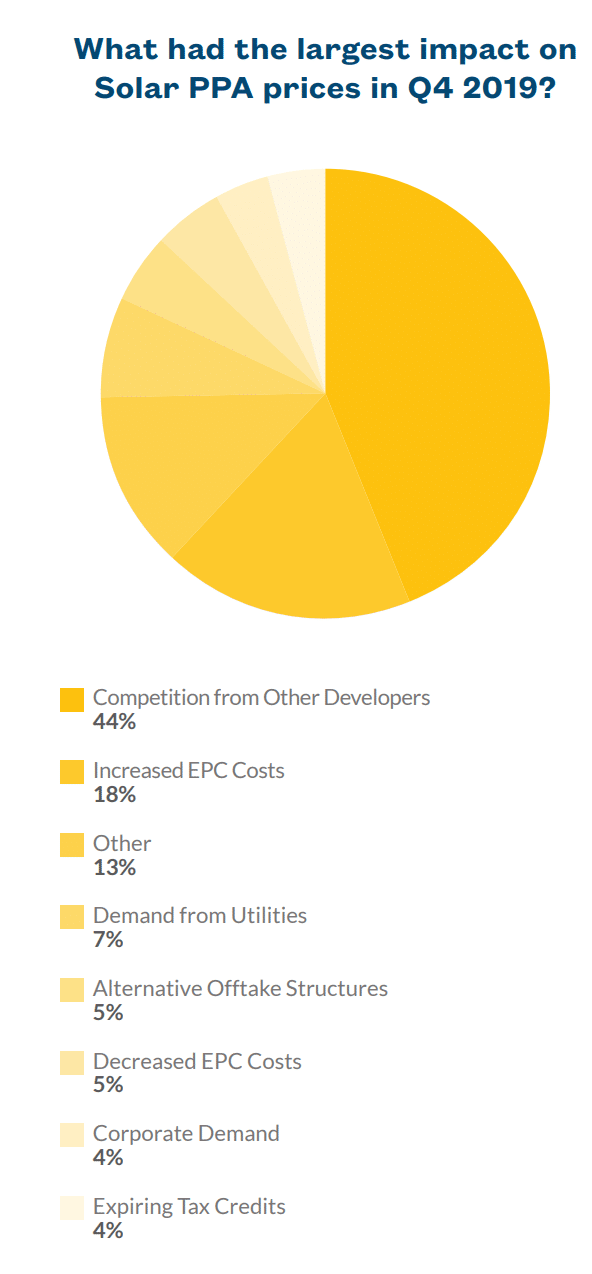
LevelTen’s market survey found that the No. 1 reason for these price changes was developer competition, the same leading response since the survey began. An increase in the costs of engineering, procurement and construction was another important factor – with 18% seeing higher pricing. Concurrently, 5% said a decrease in the same items drove down their pricing.
During the course of 2019, while solar prices were continuing to nudge downward in the U.S.A. and globally, a record number of 19.5 GW of clean energy corporate PPAs were signed by 100 corporations in 23 countries, according to BNEF.
The United States signed up for 13.6 GW of corporate PPAs in 2019. Just over 11 GW of those contracts were signed in deregulated markets and were virtual PPAs — meaning off-site, and using third-party owned powerlines.
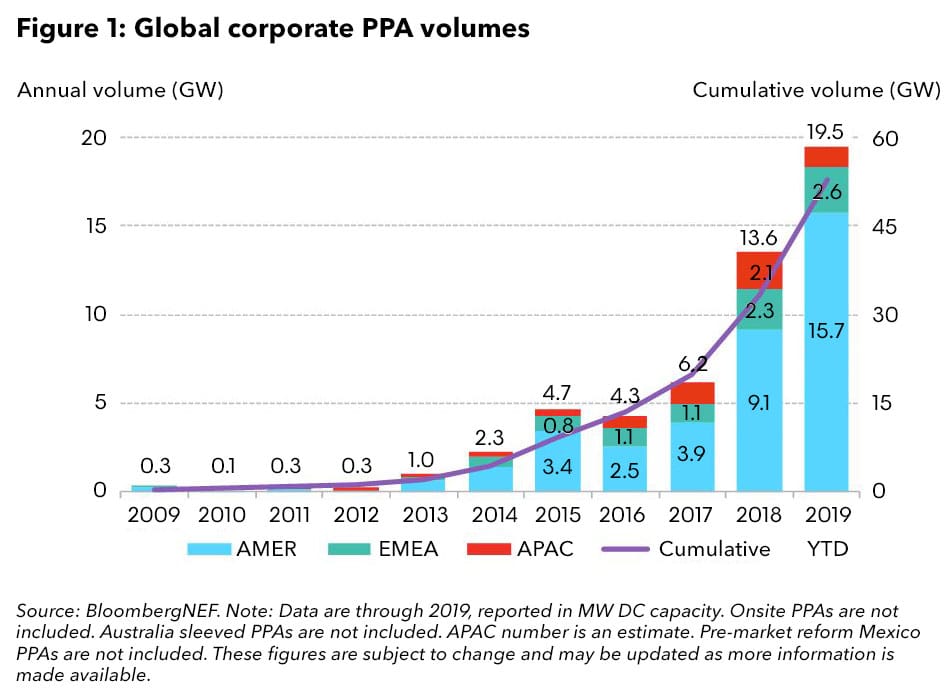
Globally, Google was the biggest off-taker with just over 2.7 GW signed, including a 1.9 GW purchase in September and a reverse auction process that led to 1.2 GW of deals signed after just 60 seconds of bidding. Anheuser-Busch signed a deal for a 222 MWac plant in West Texas.
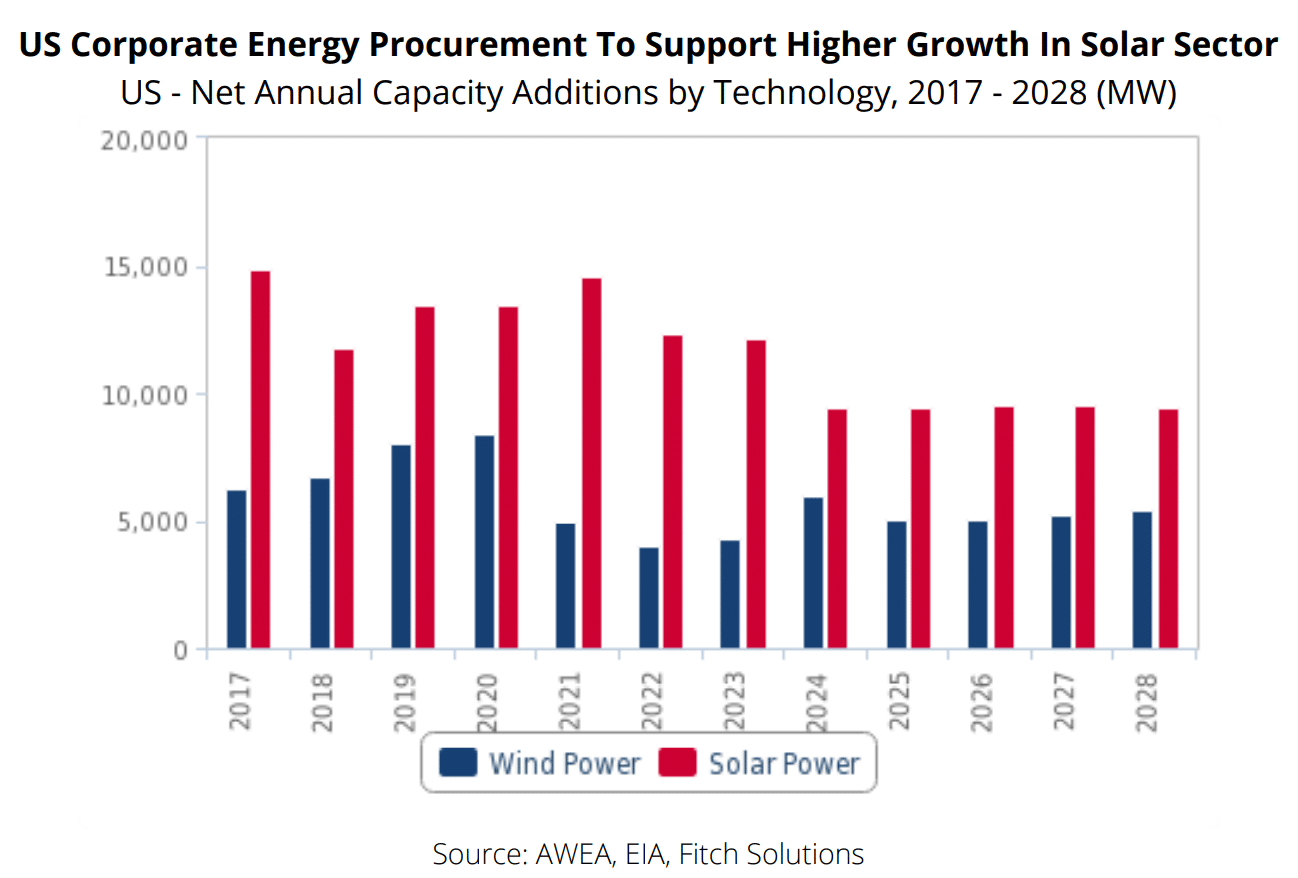
Looking forward, Fitch Solutions’ ten-year forecast for the U.S. corporate wind and solar power sectors predicts capacity growth to average 3.9% and 7.9% annually between 2022 and 2028 –- with upward forecast revisions likely as more corporations commit to renewable electricity targets and the procurement process is further simplified.
The image below shows current solar procurement projections, with a peak just short of 15 GW in 2021 and then tailing off toward 10 GW per year through 2028 – for around 117 GW of total capacity by the end of 2028 (including the 40.5 GW between 2017-2019).
This content is protected by copyright and may not be reused. If you want to cooperate with us and would like to reuse some of our content, please contact: editors@pv-magazine.com.


By submitting this form you agree to pv magazine using your data for the purposes of publishing your comment.
Your personal data will only be disclosed or otherwise transmitted to third parties for the purposes of spam filtering or if this is necessary for technical maintenance of the website. Any other transfer to third parties will not take place unless this is justified on the basis of applicable data protection regulations or if pv magazine is legally obliged to do so.
You may revoke this consent at any time with effect for the future, in which case your personal data will be deleted immediately. Otherwise, your data will be deleted if pv magazine has processed your request or the purpose of data storage is fulfilled.
Further information on data privacy can be found in our Data Protection Policy.