The US Department of Energy’s National Renewable Energy Lab (NREL) has released its 2019 Standard Scenario tools and analysis. The report looks at a combination of broad combination of variables to create models of potential outcomes in the US electricity system through 2050.
Across the full set of scenarios, the models show wind and solar providing between 21-62% of total installed capacity and 17%–72% of total generation. While coal and nuclear show decline in all scenarios, gas shows the widest range of outcomes with it most being affected by the price of itself and energy storage.
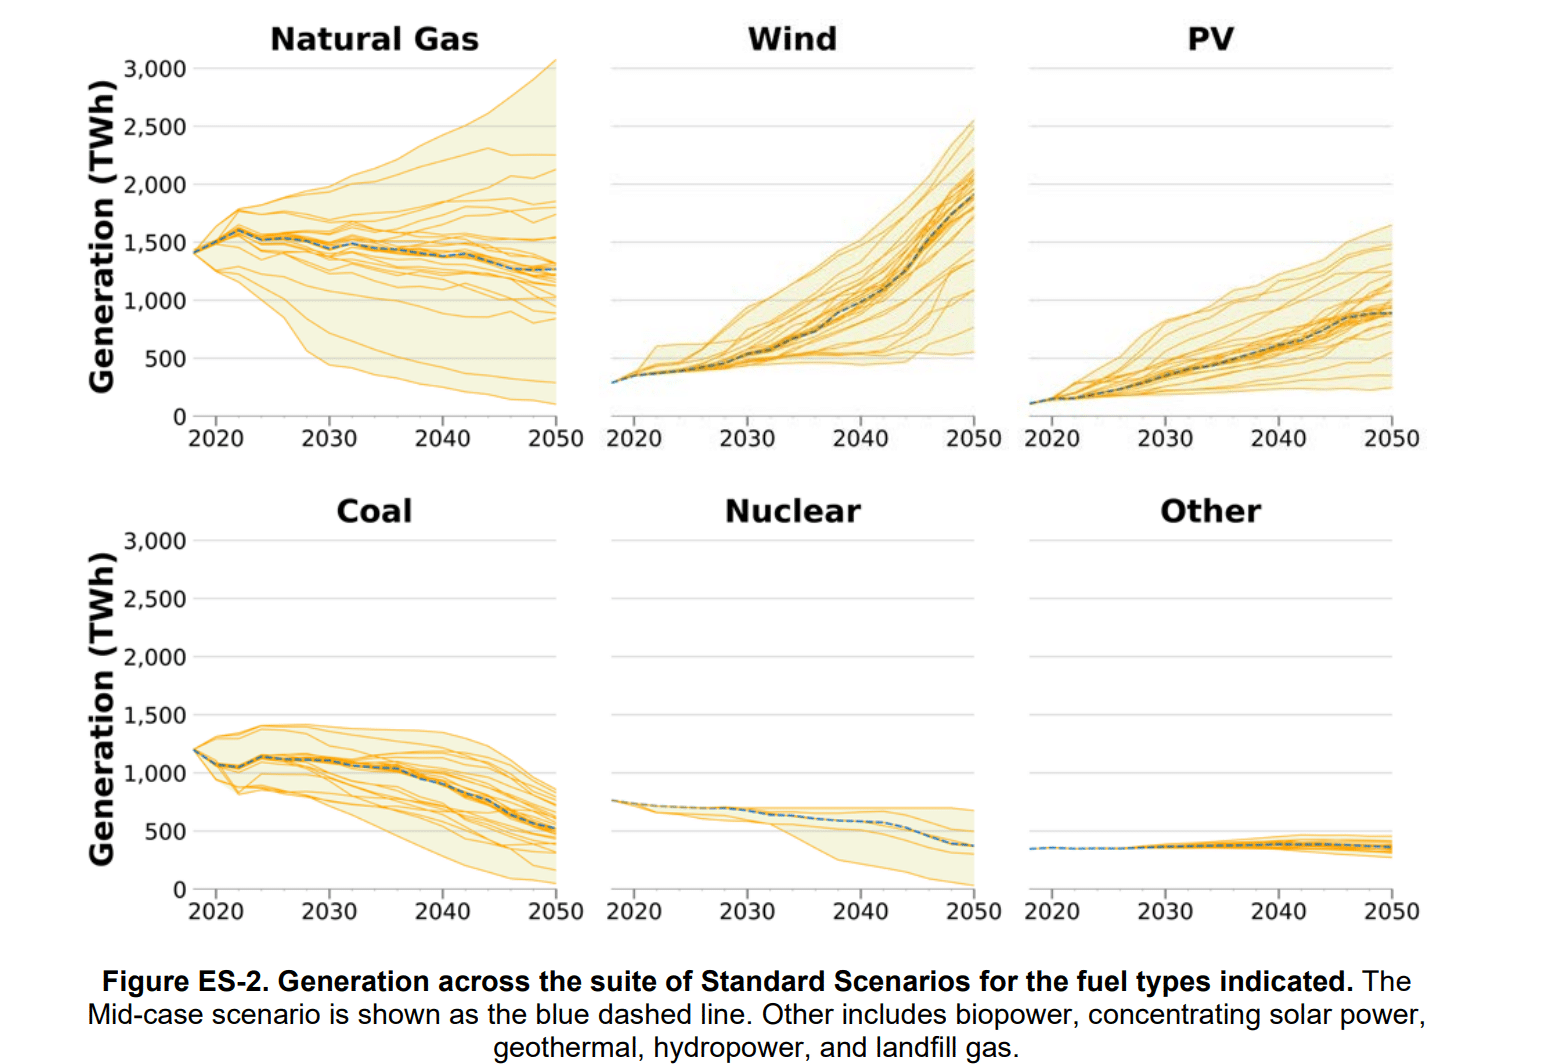
The mid-case scenario got a decent amount of attention as it was considered possibly pragmatic. In the scenario total generation grows, provided primarily by a mix of new natural gas combined cycle, PV, and wind generation.
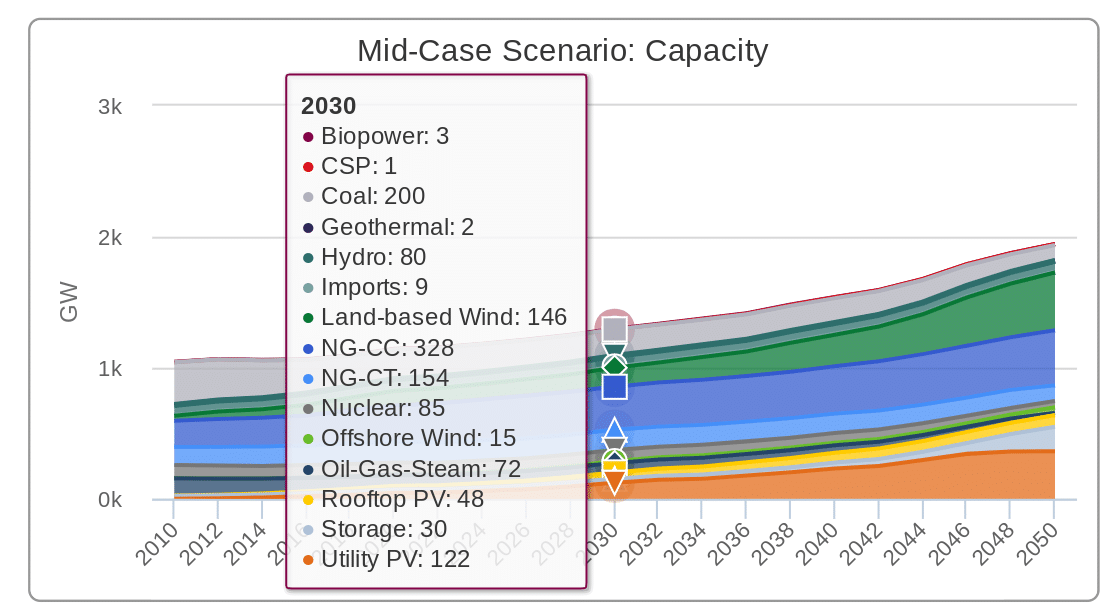
In the late 2040s, wind and PV generation increase more rapidly as more rapid retirements that occur then. Respectively, wind and solar, fossils, and nuclear are generation 28%, 57%, and 15% of electricity in 2030 and 60%, 33%, and 7% in 2050. The total 2030 projection shown in the below image sees a cumulative capacity 48GWac of rooftop, and 122GWac of utility scale solar power.
Wind and solar at 28% of overall generation in 2030, would be more than 2.5 times the just greater than 10% of US electricity generation that occured in the first half of 2019. And if we use a DC:AC capacity factor of 1.3:1, then the projected 221GWdc of total solar power will about triple our currently installed capacity of ~75GWdc.
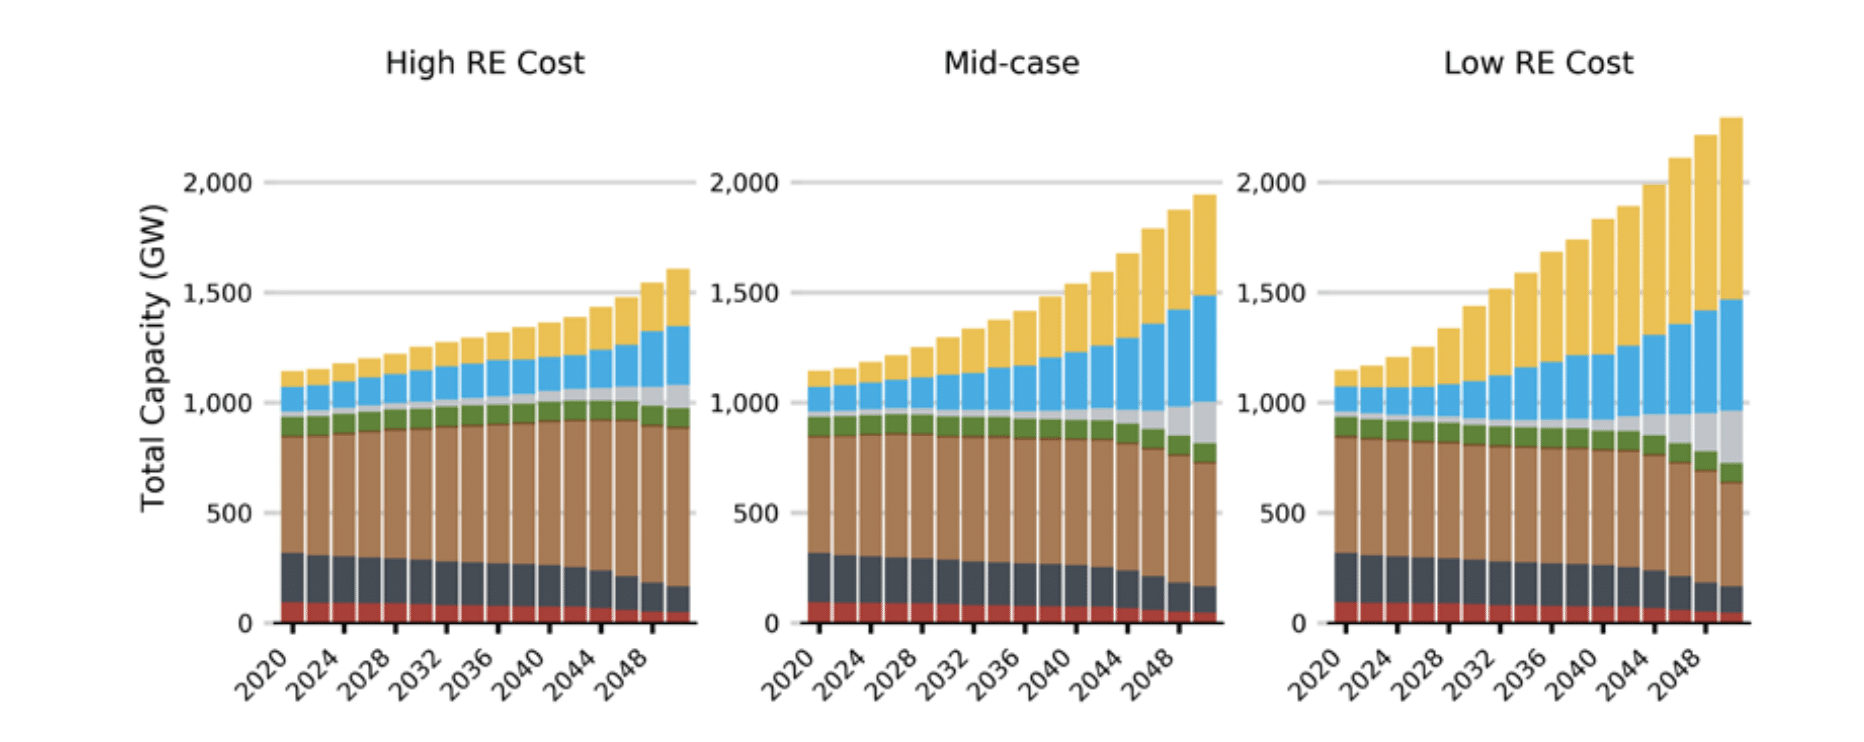
Energy storage starts to have a much greater effect as time goes on, with this beginning to accelerate, as the “overnight capital cost of 4-hour battery storage is assumed to decline below that of NG-CTs from approximately 2030 onward in most scenarios”. The report suggests that at this point energy storage becomes the most common type of peaking plant. The mid case scenario suggests 165 GW / 656 GWh of energy storage is deployed, however, a lower energy storage cost model sees that volume more than doubling.
One model that looks at higher gas prices than average and lower renewable costs than projected sees that by 2030 there is 410GWac of solar power installed – which would mean we’d be installing seven times as much solar in the next ten years as we have to date in the United States. By the year 2050, in this model, this suggests 888GWac / 1.2TWdc of solar power is installed meeting 28% of all electricity needs.
One interesting finding was that as the price of renewables heads down, it makes more sense to build local generation capacity and energy versus powerlines to move cheaper electricity from higher production regions. This suggests that many areas, not just the southwest and Texas, are ripe for project development.
The various scenario outputs can be seen in more detail using the Standard Scenario Results Viewer. If you’d like to to hear about project insights, challenges, and applications of the tool, then join NREL for a webinar on Jan. 9, 2020, at 11 a.m. Mountain Time.
This content is protected by copyright and may not be reused. If you want to cooperate with us and would like to reuse some of our content, please contact: editors@pv-magazine.com.


Thanks for the update John, natural gas like most fueled technology drivers is under scrutiny from so many facets, it’s becoming an up hill battle. The technology surge in solar PV alone is pushing hard against spending money on natural gas plants or retrofitting newer coal fired plants. Natural gas, still a commodity fuel is still victim to labor strikes, environmental emissions, natural disasters and transportation interruptions. Non-fueled generation does not suffer from these constraints. Intermittency in solar PV and wind can be addressed by distributed energy storage systems constricted along the grid infrastructure. There is a political component to natural gas a lot of folks who ‘predict’ such things are not taking into consideration. Ageing infrastructure that is inadequate to plain under maintained. Sooner or later it will have to be determined where capital will be spent by the utilities, building and undergrounding HV feeder lines or new gas lines. A lot of the existing natural gas infrastructure is under 99 year leased right of way through “Sovereign Indian Nation” lands. When these contracts are up, do you believe there will be another 99 year lease signed? I don’t think it will ever happen again the 99 year lease. So, one can expect natural gas prices to go up regularly from now on. Solar PV is coming down in price point every decade so far. (IF) the manufacturing sector gets to the razor’s edge on costs, it will take the very solar PV these companies make and energy storage to drive down manufacturing costs to compete in the international market place.
“Wind and solar at 28% of overall generation in 2030, would be more than 2.5 times the just greater than 10% of US electricity generation that occurred in the first half of 2019. And if we use a DC:AC capacity factor of 1.3:1, then the projected 221GWdc of total solar power will about triple our currently installed capacity of ~75GWdc.”
There is no ‘head room’ in using natural gas as a generation resource.
Over all, getting rid of transformer losses along the grid is tantamount to redefining the grid as loosely connected micro-grids with fewer transformer step losses from end to end. More efficiency means less ‘centralized’ generation needed end to end and better control over generation assets using CIP with O&M programs to incrementally increase a generation plant’s output as new technology comes along.
Good article, but it seems to us this analysis is still devoid of two things: 1) basic Micro Economics at extreme price changes and 2) Climate. We all know the Climate front, and it is becoming a stronger and stronger driver. But it is Climate PLUS Micro Economics that will rule the day. The DOE/EERE’s #SunShot2030 initiative (worth reporting on!) will drive Utility Scale PV to at least 50% cheaper than in 2017 … and PV costs are well on the way there! In 2017, PV was already the cheapest raw power on average according to Lazard (see annotated Lazard “Market” graphic on our website). At 50% lower PV cost, the Micro Economic pressure will be so great for daytime power generation, including most EV charging to keep the system balanced, that PV growth will be extreme. At 50% lower cost than Already Cheapest Raw Power, PV will be unstoppable. Especially as battery costs also drop precipitously … which they are!
The “Low RE Cost”/High PV Growth scenario is definitely most likely once basic Micro Economics and Climate are taken into account!
Comparing this analysis with the DRV analysis you reported on Jan. 7 is a stark contrast. I find it incredible that NREL is including any models that show thermal coal use higher in 2040 than 2020, or wind and solar essentially flat over that timespan. The question is not whether but how fast we shift away from natural gas for electricity production and heating, and gasoline for transportation; the death of thermal coal in North America should be a given. Companies like the coal operators in Ohio are lobbying to stack the deck in support of their current business model, at the expense of ratepayers, but I can’t look at the downward trend that has continued for more than 10 years with a strong and growing economic basis, and conceive of a scenario that includes coal in 2040.
Likewise, the competitiveness of natural gas is already faltering and that will only get worse.
As for gasoline, 10% of new car sales in California last year were plug-ins, with the Model 3 leading the pack. Within 3 years it will save money for virtually every 2-car family to have at least one electric car. Electric delivery vans and bicycles will further cut into gas use for short trips. Any disruption to the gas supply caused by Middle East tensions or whatever will only accelerate this electrification trend.
A quick response Bruce, we didn’t coordinate these two articles being written. There is independence in our choice and not full transparency between the authors at pv magazine. Would that though, it was cool to see two separate reports with different ideas deployed.