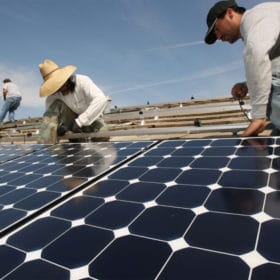
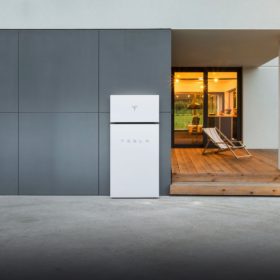
New York state recently hit 2GW of solar power installed, and has five years to install the next 4GW. The state is also aiming to install 1.5 GW of energy storage capacity by 2025 and 3 GW by 2030 while trying to figure out how to deal with a potential winter time solar duck curve and one of the most unique cities on the planet – Manhattan.
As part of the its broader discussion on the value of distributed energy resources (DER), New York’s Public Utility Commission (PUC) has published a whitepaper on rate design for a mass market Net Metering (NEM) successor tariff for solar power projects smaller than 750kWac. The recommendations by the PUC suggest that onsite NEM customers be required to choose from among set billing structures that include demand charge and time-of-use variables.
As part of the presentation, the PUC staff suggested extending net metering for all projects below 750kWac for an additional year, — and the PUC did approve this extension.
The group studied four billing structures based on various applications of time-of-use and demand charges, and three sensitivities. The unique structures were:
- Joint Utilities time-of-use with demand charge
- Joint Utilities with two demand charges
- Clean Energy Parties TOU
- Alternative TOU without demand charges
- Sensitivity: Alternative TOU with reduced customer charge
- Sensitivity: Joint Utilities with reduced demand charges
- Sensitivity: Clean Energy Parties’ TOU with reduced customer charge
Energy storage will be used in the state to mitigate these effects — with big incentives and projects moving in already.

The above chart shows an analysis performed by the DER working group which showed the costs shifts from NEM customers to non-NEM customers. The values range from $3.16 to $7.28/kWdc per month. Some of these cost shifts included fees that all electricity users paid as taxes into clean energy programs that NEM customers benefit from. One suggestion is to create a “Customer Benefit Contribution” charge of between $0.69/kW to $1.09/kW depending on utility and customer class to balance out these clean energy taxes.
The report did try to account for changes on a project’s return on investment. For instance, the above Customer Benefit Contribution would have a “relatively subtle effect on the economics of solar, with expected increases to simple payback ranging from 0.2 years in Con Edison to 1.4 years in NYSEG, and averaging 0.7 years across all service territories.”
The report assumed that 50% of residential solar was consumed onsite immediately — at 50% net metered, while 70% of a small commercial installation was consumed immediately.

The document breaks down the four programs and three sensitivities affecting electricity bills. The above image shows a residential electricity bill with costs broken out based upon the various billing techniques. The total avoided costs as well avoided supply costs are broken out with the solid and dotted lines above.
The below chart looks at the same information, but in a different format and focuses on the small commercial service class. A smart developer would focus the highest rate customers, balanced by the cost to install in that region, in order to maximize customer return on investment.

This content is protected by copyright and may not be reused. If you want to cooperate with us and would like to reuse some of our content, please contact: editors@pv-magazine.com.


“The recommendations by the PUC suggest that onsite NEM customers be required to choose from among set billing structures that include demand charge and time-of-use variables.”
All these types of programs do is dilute the value of distributed solar PV and rate spike after solar PV peak generation hours to create a spiked revenue stream based on the pundit of the “duck curve”. The peoples work-a-day lives do not necessarily ‘mesh’ with the utility’s ‘vision’ of the TOU. Right now the home or business owner should get smart ESS and use arbitrage to slip past the utility’s usury of the TOU and demand rate spiking. The utility can trip over their big floppy red shoes and fall on their bulbous red noses for doing such idiot things.
Manhattan is not a city, New York City is. Manhattan is a borough within the city, a county within the state, and an island. It has a high concentration of skyscrapers and a dense population, but not separated from its surroundings for power purposes.
Add wind generation to the new solar and storage mix, to help fill in the duck curve.
What would be most advantageous to the rate payer in the future when the reduced costs of solar are realized and the benefits are paston to the American public.
Just joking of course. Can you imagine the ratepayer benefiting.
Can you imagine the homeowner investing in his home adding solar and realizing a return on investment?
The wars against net metering are nothing more than ensuring the ratepayer will never benefit from the reduced costs of generation.
The war against the net metering concept has been under scrutiny and in court for about 10 years now. The utility’s self destruction is built into its ability to ask for and receive electricity rate increases based on “lost revenues”. Since solar PV has dropped in price on average 95% since 2010, it is easy for the adopter to over design and install 20%, 30% more solar PV than they could just 10 years ago. The price of energy storage is coming down, so it is also becoming more popular to adopt solar PV and energy storage as a system.
The ability of a smart energy storage system is the elegance in which the home or business owner can program around the specific utility programs allowed to reduce the value of solar PV excess generation and storing the excess for ‘self consumption’. This allows the homeowner to extend the solar PV powered day of the home. It also makes the once 2,000 square foot home look like a 1,000 square foot home to the utility. Under the “lost revenues” mandate, the utility will once again cry to the PUC and increase electricity rates to the ratepayers. More ratepayers will become disenfranchised with the utility and more folks will pay it forward and adopt solar PV with ESS as their system of choice. The early adopters will be looking for a “retrofit” to their grid tied system to use ESS to enhance their daily use of their own solar PV generated power.