
Some rounds of the fight you take a few extra punches. Your footing is slow, the opposition’s setup paid off, and maybe there was extra fat to trim from a well fed 2016. However, we’re in the early rounds, and we know the next few years are going to see growth, so stay focused.
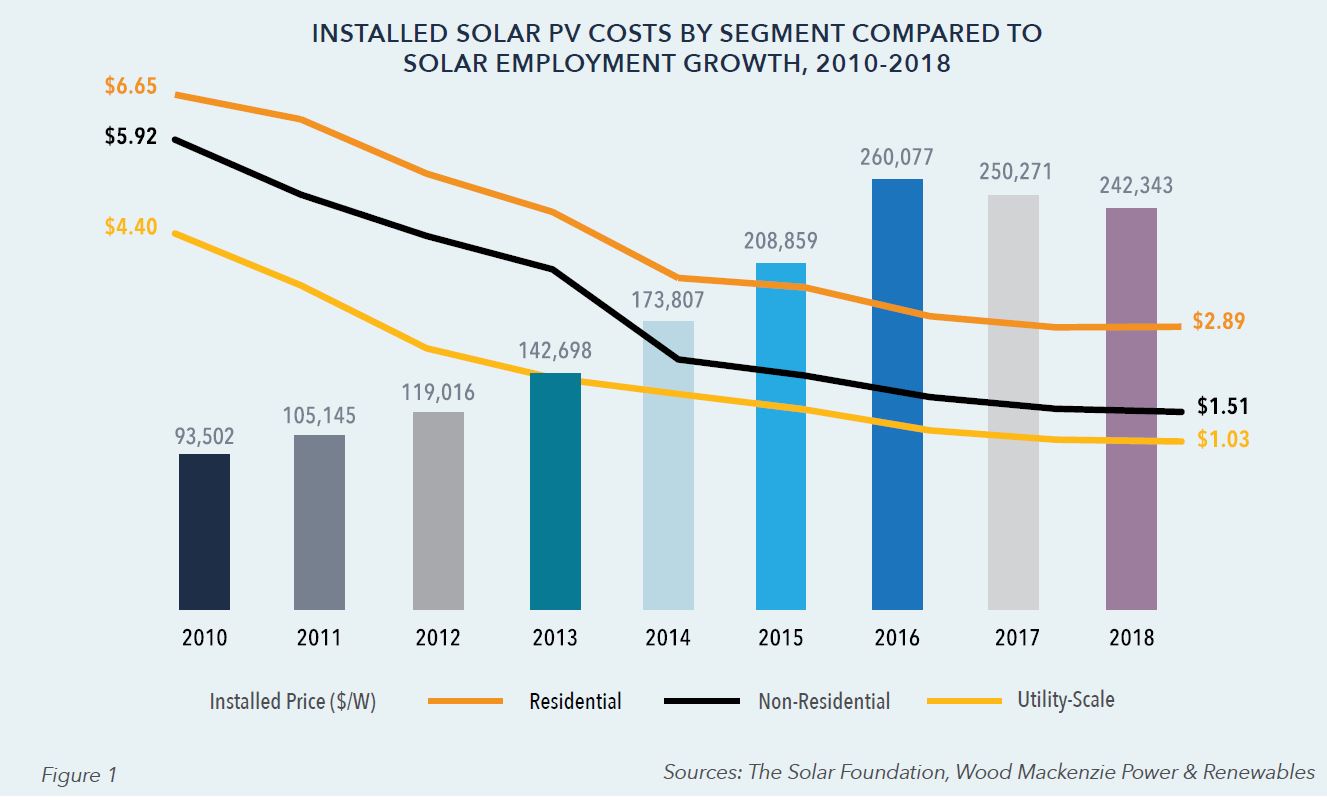
In 2018, those directly and wholly employed by the solar power industry fell by just under 8,000 jobs – 3.2%, from 250,271 employees to 242,343, per the Solar Foundation’s 2018 National Solar Jobs Census. These job losses occurred while Wood Mackenzie Renewables & Power projected slight growth in total volume deployed.
And while these simple numbers don’t fully account for all solar jobs in order to keep year-on-year comparisons consistent – for instance Puerto Rico has 2,000 solar jobs noted in the first year counted by the Solar Foundation, and 3,900 jobs in solar + storage that are slightly outside of the pure solar industry are also skipped – the numbers do show how laws in a couple of states have kept the “solar coaster” moving in a variety of directions.
Link to Appendix A: Solar Jobs by State (pdf).
21 states saw job losses – below image, while broad swaths of the Midwest and Northeast (excluding New England), grew their industry employment base. And two states – California and Massachusetts – saw more job losses at over 10,000 than the country lost as a whole.
California’s electricity utilities aggressively hit their clean energy goals and then slowed deployments. And while recent laws in the state – a mandate for residential solar on new homes plus 100% clean energy – have put it on a path toward more solar volume, those initiatives have as of yet to show up in the numbers.
Massachusetts saw a second year of market stagnation in the above 25 kW space as the transition from the SREC II program in January of 2016, just completed in November of 2018 – with significant slowdowns occurring across the development marketplace.
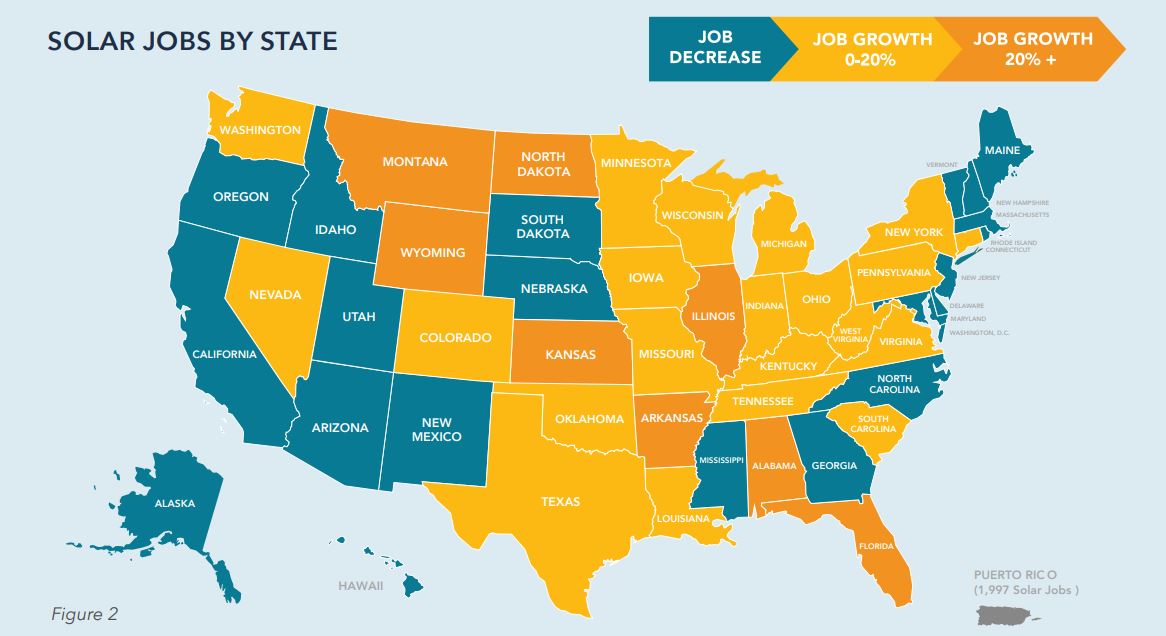
Inversely, Illinois, Nevada and New York solar policy directly led to significant growth within these states. And while Texas and Florida did not alter their legislative paths at all, both showed significant growth.
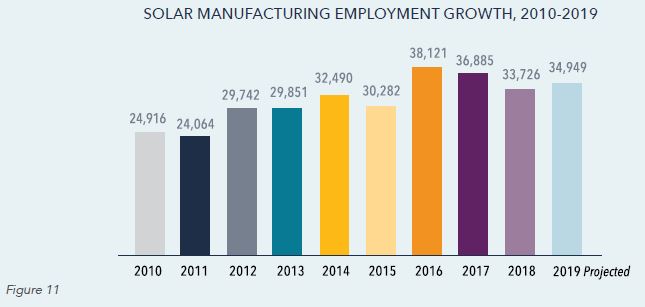
Regarding the gorilla on the roof – solar tariffs – as of yet, there have been no significant gains in manufacturing jobs in the United States since the tariffs have been placed against imports. However, there is around 4 GW of solar module manufacturing capacity under construction and expected to come online by the end of this year. As fewer than 1,000 jobs per GW of solar module manufacturing are produced, do not expect these new factories to affect the broader job market significantly.
Looking forward, the Solar Foundation also projects that solar professionals are optimistic on 2019, with a projection of jobs increasing by 7% based on both solar PV and energy storage pipelines that are growing significantly.
And of course, as with all things as complex as an industry that spends tens of billions employing a quarter of a million people – the influences are far, and wide. For instance, as can be shown in the below graphic, the jobs per megawatt installed in the industry have dropped precipitously. Anecdotally speaking, this author on their own is able to do a remote site analysis using Helioscope, a state of Massachusetts environmental study with Oliver, and then import that data into financial modeling tool Energy Toolbase and deliver a high quality proposal with a 20-year pro forma that is probably 98% on final pricing for seven figure projects in 30 minutes.
https://twitter.com/StuartLWallace/status/1085913813868834816
This content is protected by copyright and may not be reused. If you want to cooperate with us and would like to reuse some of our content, please contact: editors@pv-magazine.com.


By submitting this form you agree to pv magazine using your data for the purposes of publishing your comment.
Your personal data will only be disclosed or otherwise transmitted to third parties for the purposes of spam filtering or if this is necessary for technical maintenance of the website. Any other transfer to third parties will not take place unless this is justified on the basis of applicable data protection regulations or if pv magazine is legally obliged to do so.
You may revoke this consent at any time with effect for the future, in which case your personal data will be deleted immediately. Otherwise, your data will be deleted if pv magazine has processed your request or the purpose of data storage is fulfilled.
Further information on data privacy can be found in our Data Protection Policy.