The purpose of the U.S. Solar Photovoltaic System Cost Benchmark: Q1 2018 is to provide bottom-up accounting for all system and project-development costs incurred – breaking down hardware, labor and engineering costs. It gives us a base price to start our work from.
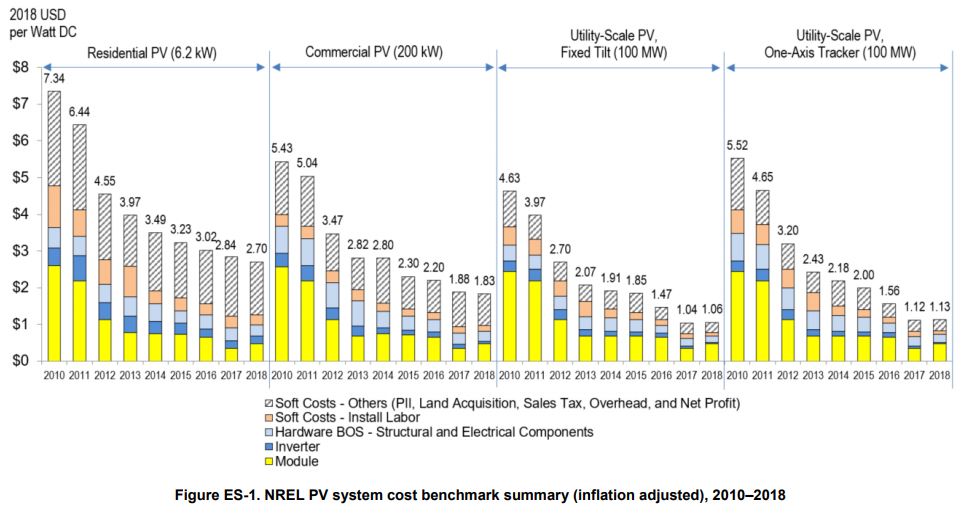
The report, done by the Department of Energy’s National Renewable Energy Lab (NREL), specifically notes that Q1 2018 system costs of $2.70 per Watt-DC (Wdc) for residential, a 4.9% decline, $1.83/Wdc for commercial, a 2.6% decrease, $1.06/Wdc for fixed-tilt utility-scale – a 1.9% increase, and $1.13/Wdc single-axis-tracking utility-scale – a 0.9% increase.
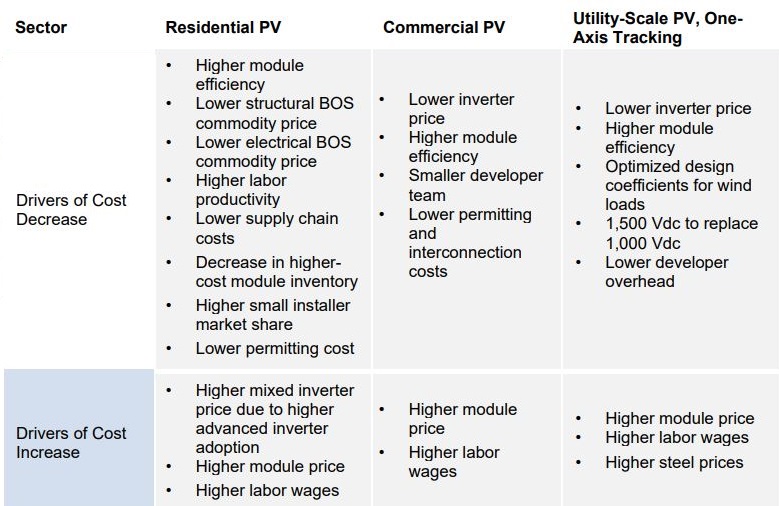
At a high level, the report authors noted that higher module prices, higher wages for labor, and higher steel prices raised costs – while higher-voltage inverter designs, lower inverter prices, and higher module efficiencies contributed to cost reductions. However, the effects varied by industry sector (below image), and change could be seen in many market areas.
Hardware costs, as a whole, didn’t fall, but we saw soft costs fall as part of the overall price in all market segments for the first time since 2015.
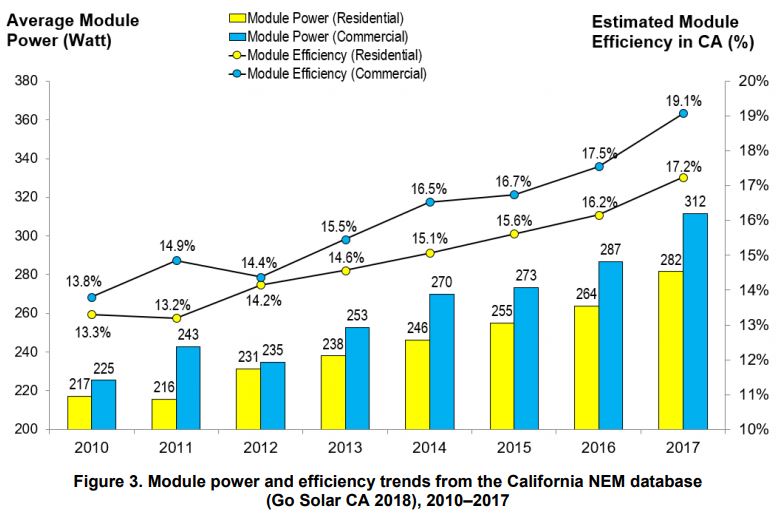
Solar module efficiency is really racing upward, with commercial projects in California seeing a 9.1% efficiency increase over 2017, and the average residential efficiency climbing 6%. As efficiencies increase, many other items drop in cost per watt, since solar module ratings drive so much of the system’s price.
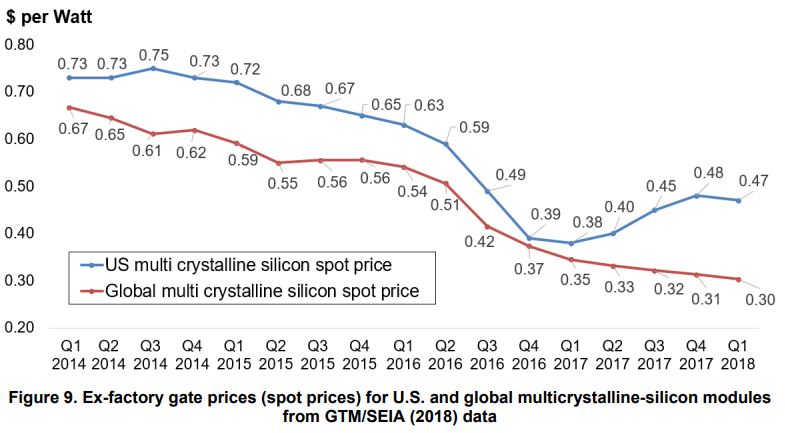
Module pricing is definitely slowing the U.S. price declines, as Q4 2017 and Q1 2018 saw a 17¢/W price difference inside of the United States versus the global price for polycrystalline silicon solar modules. Much has occurred in the world markets since the end of Q1 (China dropping the floor from under utility scale procurement), that has seen global module pricing fall closer to 25¢/W, and have had an effect on U.S. market as well.
The report shows off differentiation on pricing per state in the residential market quite nicely – with the Massachusetts sales, labor, and taxes (but not profit) pushing its prices – $2.87/Wdc – 13% greater than Texas at $2.53/Wdc.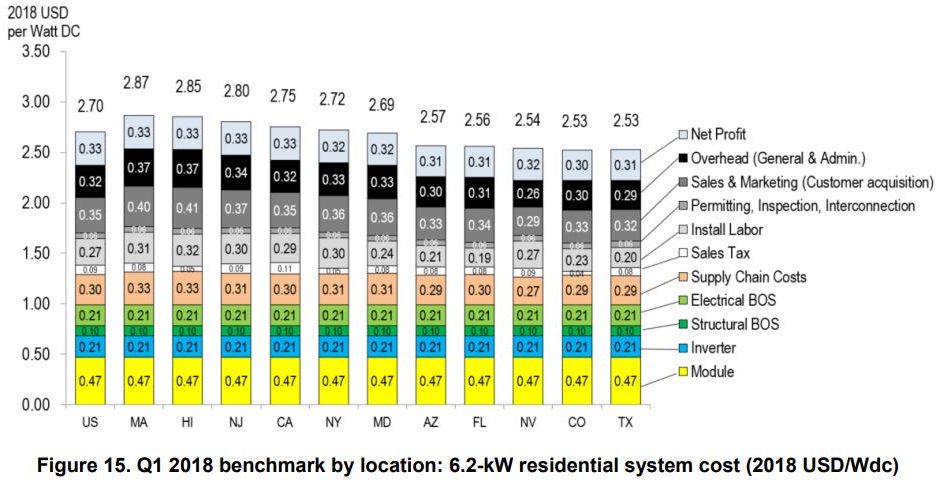
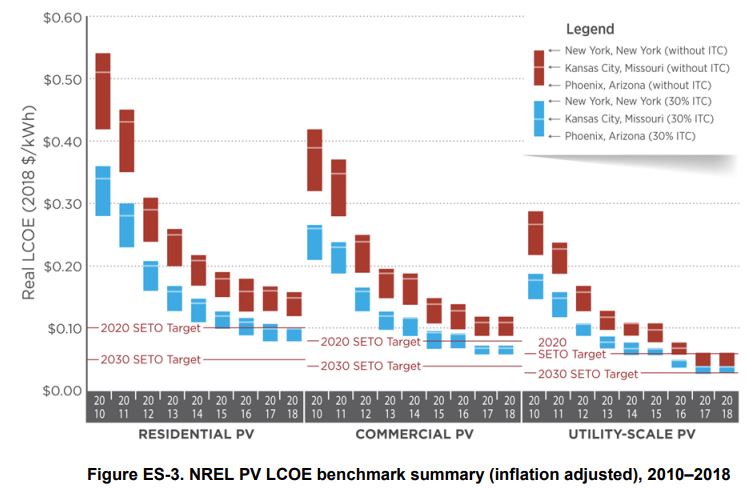
Also, looking at the levelized cost of electricity (LCOE) coming from these systems, the analysts found residential and commercial systems are 89% and 91% toward achieving the Department of Energy – Solar Energy Technologies Office’s (SETO) 2020 electricity price targets (10¢/kWh for residential, and 8¢/kWh for commercial), and that utility-scale PV systems have achieved their 2020 SETO target 3 years early (6¢/kWh). SETO’s 2030 goals are 5¢, 4¢ and 3¢/kWh for residential, commercial and utility-scale solar, respectively.
Ran Fu authored the report with fellow NREL researchers David Feldman, Mike Woodhouse, and Robert Margolis. The report has many further interesting data points.
Help us learn more about you and your interests by taking pv magazine USA’s audience survey.
This content is protected by copyright and may not be reused. If you want to cooperate with us and would like to reuse some of our content, please contact: editors@pv-magazine.com.


Even before the tariffs it looks like the U.S. spot prices for modules was higher. Any reason for that?
If I’m remembering correctly the tariff gets cut by 1/4 in 2019 so that should bring the cost down a little so that should help.
The US has had tariffs in place since 2012-2014’ish, two separate rounds of tariffs. The two prior rounds were first against Chinese companies, and then companies that were subsidiaries of Chinese companies around the world.
The biggest efficiency gain is from the SunPower panels that are the best in history. They produce the most in the heat and low light as well as the most overall. As they sell more because people see how much better that are it raises the overall efficiency.
They can also use their solar cells on concentrated solar since they run so cool. Most others would fail in a short time and other try to increase the light by 10 to 100 times. SunPower uses the C7 system to raise the light levels while still having super long life.
Very Educational.!!!
I am trying to get permit from city of Corona, CA 92882 (large scale), flat lot, middle of the city.
If approved, I would like your Input and participation! I just submited papers today, 12/20/18.
Felix Burotto
Lemme know!