Boston set a record August 29th with the temperature at 98 degrees and the highest peak in New England – Mt Washington – set a record of 65 degrees recently. And while 65 degrees may not seem particularly warm, back in January Mt Washington was the second coldest place on the planet.
With all that, this summer has been a hot one in which grids in several parts of the nation have leaned heavily on solar power. We saw hints of this coming back in the cool spring days of April when it became clear that New England had developed a case of the duck curves, with solar meeting 20% of demand and pushing peak pricing to after sundown. On July 19 solar provided as much as 15% of total electricity in New England, knocking a full 2 GW off of demand at its peak and shifting that peak to the early evening.
Recent data from the Department of Energy showed the changes in electricity generation of New England to the broader world, with solar representing more than 10% of in-state electricity generation in both Massachusetts and Vermont in the first half of 2018.
As this summer cruises into September, SunCommon decided to quantify a portion of the value of solar in a new pair of reports by Synapse Energy Economics: Wholesale Cost Savings of Distributed Solar in New England & New York.

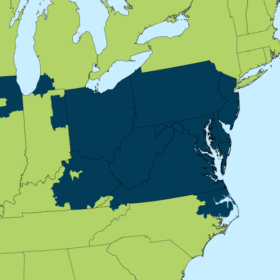
The reports look specifically at the wholesale pricing market and how solar power lowered the amount of demand on the grid, which in turn lowered the price of electricity. During the six days of July 1 – 7, 2018 the wholesale electricity markets saved approximately $29.9 million. New York saved $10.2 million, while New England’s savings totaled $19.7 million.
On Tuesday July 3, New England and New York combined to save $6.7 million. During the whole of the week, New York saved 6% of its wholesale costs and New England saved 14%. Between the two regions, 154 GWh of solar electricity was generated – with New York peaking at approximately 1 GW of solar generation and New England at 1.6 GW, representing 3% and 7% of the peak demand, respectively, during the week.

Though back in April solar made up more of total demand (20%), the yellow sliver at the top of that curve on July 3 was much pricier during the summer heat waves – and so very valuable for the grid. Nor has this phenomenon ended for the year, as just yesterday we saw New England electricity pricing hitting extremes.
These numbers don’t account for the role that energy storage is playing, and Green Mountain Power has estimated that Vermont was able to save $500,000 during the heat waves due to its distributed energy storage facilities.
This content is protected by copyright and may not be reused. If you want to cooperate with us and would like to reuse some of our content, please contact: editors@pv-magazine.com.


My IT services show a security threat when I try to download maps FYI
Which maps?
How can they quantify the BTM load met by solar when by definition is is behind the grid meters? Is it estimated based on solar output simulation?
Its in the report around pages 13-14, some estimating of behind the meter production they noted.
https://suncommon.com/wp-content/uploads/2018/08/Wholesale-Cost-Savings-of-Distributed-Solar-New-England-SunCommon.pdf
Page 13-14
When they installed my solar, they installed 2 meters, one which measures the solar generation after the inverter, but before the house load, and the other coming from the grid. (The one that ‘runs backwards’).