
Data released today for the first half of 2018 shows solar representing more than 10% of in-state electricity generation in a fifth state, as further evidence that the energy transition is underway.
The August 2018 edition of Electric Power Monthly, a publication by the U.S. Department of Energy’s Energy Information Administration (EIA) shows electricity generation from solar in Massachusetts growing 34% year-over-year to 1.64 terawatt-hours (TWh) in the first six months of 2018 and representing 12% of the state’s total generation.
There is an irony to this development, given that Massachusetts is still waiting on the final form of the SMART solar incentive policy, and that commercial, industrial and large-scale solar markets are all on hold in some parts of the state due to caps on net metering.
Massachusetts joins four other states where solar represented more than 10% of electricity generation: California, Hawaii, Nevada and Vermont, as the second state in New England to achieve this status. Solar generation increased 24% year-over-year in Vermont and also represents 12% of generation.
In New England, the new high levels of rooftop solar generation caused net daytime power demand to sometimes fall below evening demand this summer, and are also saving substantial sums for ratepayers during heat waves.
But both of these states are still far from California, where solar generation grew 20% from the first half of 2018 and represented more than 19% of in-state generation. What all three states have in common is that they are net importers of electricity, so the actual portion of electricity demand met with in-state solar is lower than the portion of in-state generation that solar represents.
pv magazine previously reported on solar as a portion of demand met; however this is inherently speculative as line losses must be estimated, and as a result we have moved to reporting on solar as a percentage of total electricity generation. And while using the metric of demand met would put Massachusetts and Vermont below 10%, solar is still easily meeting more than 15% of demand in California.
California’s ongoing deployment shows the utter falsehood of claims that solar will stall out when it reaches a certain portion of electricity generation.
Hawaii and Nevada round out the 10%+ club, with solar representing 12% and 13% of generation, respectively. Solar generation grew only 8% year-over-year in Hawaii, with installations plummeting as a result of the policies implemented after regulators abruptly shut off net metering, but grew 20% in Nevada.
Overall solar in the United States grew 28% to reach 48 terawatt-hours, or 2.4% of all electricity generation. Solar and wind together represented a fraction less than 10% of generation, with wind output growing 11% and expanding beyond the traditional strongholds in Texas and the Plains States to more Midwestern states as well as Oregon and New Mexico.
Gregor Macdonald
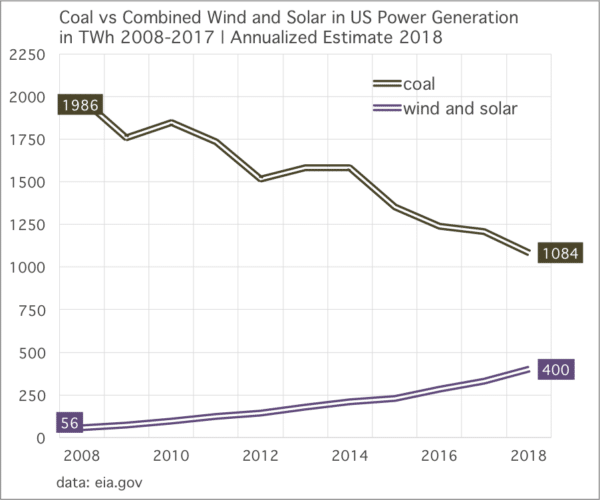
Along with this, coal generation fell 6% year-over-year, but capacity numbers tell an even more stark story. Nearly 10 GW of coal was retired in the first six months of 2018, as part of 17 GW that has gone offline in the last 12 months.
This content is protected by copyright and may not be reused. If you want to cooperate with us and would like to reuse some of our content, please contact: editors@pv-magazine.com.


So, when do the coal/solar+winds cross in the second chart? I estimate 2023-2025.
North Carolina not on the list? Thought they were 2nd in production behind CA
North Carolina has a lot of solar installed, but as a portion of in-state generation they haven’t yet reached 10%, due to having lots of other power plants and a decent-sized population.
According to my calculations of EIA data, solar represented only 5.6% of North Carolina’s in-state electricity generation. However keep in mind that in Massachusetts and Vermont solar meets less than 10% of each state’s demand, as both are big net importers of power.
As mentioned in the article we formerly looked at solar generation in relation to demand met, but we stopped doing that because in order to get hard numbers we would have to speculate on line losses, given the mix of projects and different levels of line losses for utility-scale versus C&I and residential solar.