The Solar Foundation has launched a new national map in conjunction with its annual reporting on solar jobs, which breaks down the data collected into multiple regions – including county-level jobs and U.S. congressional districts.
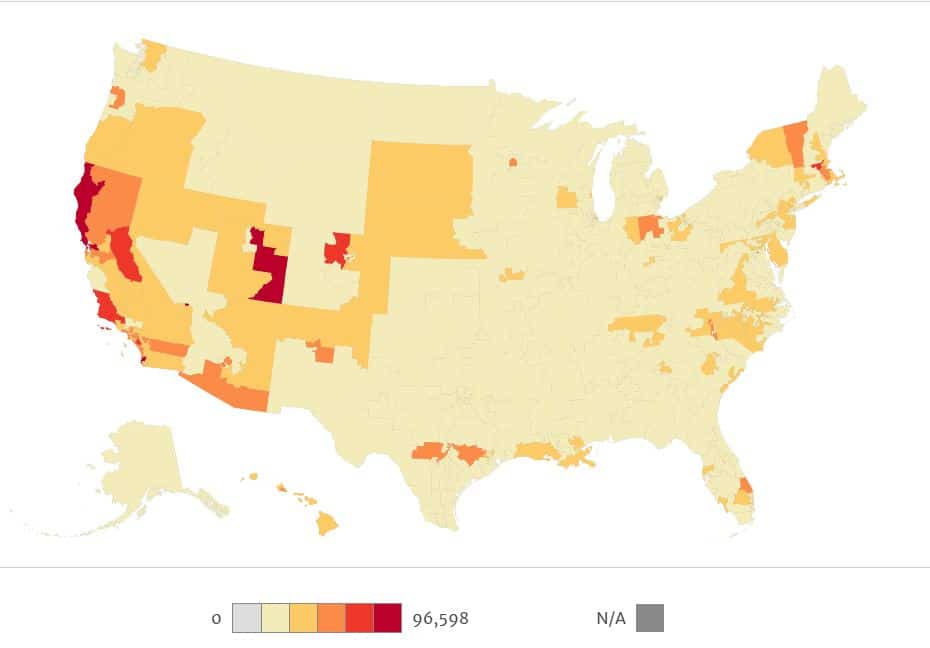
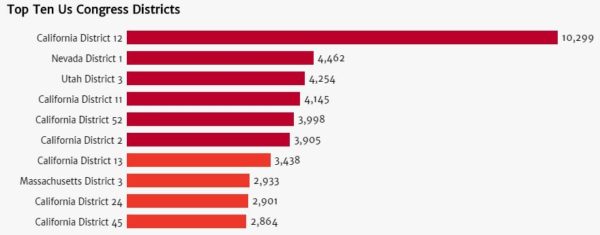
The maps U.S. congressional district view, above, shows that every single district in the country has some people who are employed in the solar power industry. The largest concentration is entirely within the city of San Francisco, which boasts over 10,000 solar employees. This is more solar jobs than all but two states – California as a whole and Massachusetts.
This is great information to share with your representatives.
The release also included 50 state fact sheets, plus information on Puerto Rico. Each state map breaks down the job situation relative to other states, whether they grew last year, what types of jobs and the cities within the state with the most solar jobs.


The jobs map also gives a map view that breaks down jobs per metro area, as well as on the county level. The San Francisco/Oakland area led the nation with almost 10% of all nationwide solar power jobs, with Los Angeles not far behind at over 18,000 jobs. San Diego with over 10,000 jobs, New York at 12,000 and Boston at almost 10,000 filled out the top five.
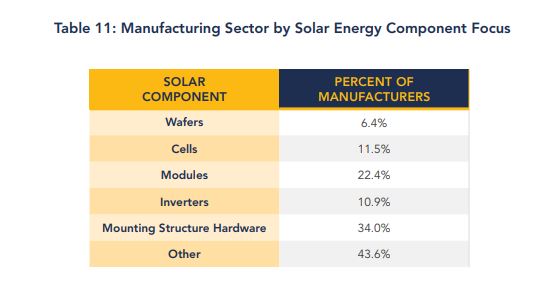
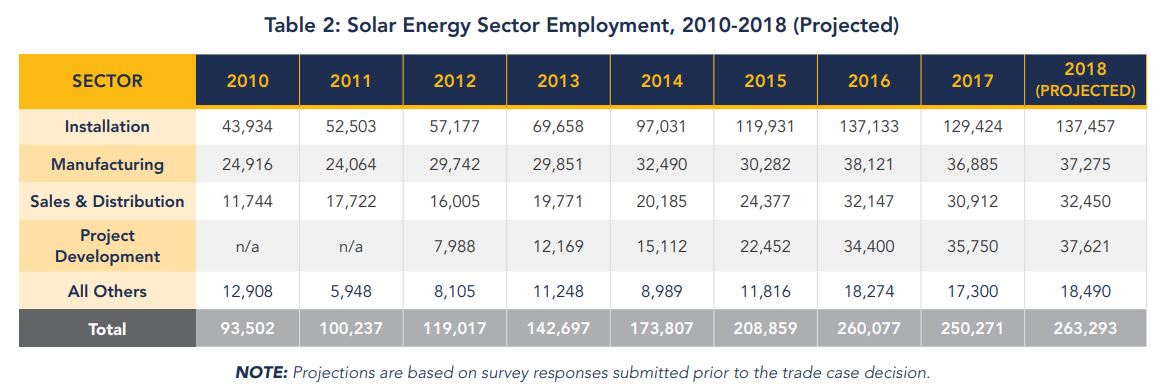
In light of the recent Section 201 tariffs on imported solar cells and modules, the breakdown of job type shows that cell and module makers make up only 1/3 of all manufacturing enterprises. In fact, over 50% of U.S. solar jobs are in installation, in contrast to only 15% in manufacturing. Of the 36,885 jobs that are in manufacturing – just over 40% of them, 14,864, are involved in the manufacturing of solar panels.
The U.S. lost just under 10,000 solar jobs in 2017 versus 2016. And while it is difficult to say exactly what caused each job loss, analysts state that a majority came as a result of the “hangover” following the boom in installations in 2016 in advance of the expected drop-down of the U.S. Investment Tax Credit (ITC). However, the Section 201 tariffs and in particular the uncertainty in the Section 201 process have also been factors. And despite predictions of U.S. job growth by Suniva and SolarWorld, the U.S. has seen announcements of less than 500 new jobs in solar cell and module manufacturing.
The report showed that California lost more than 13,000 total solar power jobs – a total greater than the decline in the entire nation. In fact, if the jobs lost in California, Massachusetts and Nevada were excluded, the United States would have seen a net increase of 8,600 jobs.
All three states saw significant slowdowns in residential solar sales – with California also suffering from a slow-down in the utility-scale market. 29 states, plus Puerto Rico and Washington D.C. saw job growth.
The Solar Foundation also projects 2018 will see an increase in solar jobs – replacing all of the positions lost in 2017, plus a few thousand more.
This content is protected by copyright and may not be reused. If you want to cooperate with us and would like to reuse some of our content, please contact: editors@pv-magazine.com.


By submitting this form you agree to pv magazine using your data for the purposes of publishing your comment.
Your personal data will only be disclosed or otherwise transmitted to third parties for the purposes of spam filtering or if this is necessary for technical maintenance of the website. Any other transfer to third parties will not take place unless this is justified on the basis of applicable data protection regulations or if pv magazine is legally obliged to do so.
You may revoke this consent at any time with effect for the future, in which case your personal data will be deleted immediately. Otherwise, your data will be deleted if pv magazine has processed your request or the purpose of data storage is fulfilled.
Further information on data privacy can be found in our Data Protection Policy.