
2017 was a tough year for the U.S. residential sector, but many of us had not realized how difficult it was until the release of GTM Research and SEIA’s Q1 2018 U.S. Solar Market Insight report, which provided final numbers for 2017.
GTM Research had given some estimates for 2017 at the Solar Power Northeast trade show in Boston in early February; however the picture painted by the final report is even more bleak. While GTM Research had estimated a 13% decline in residential installations, the final report shows a 17% fall year-over-year to only 2.2 GW installed.
This is the first time that GTM Research has reported a year-over-year fall in residential installations since the report was first published in 2010. This was felt across the top four state markets: California, New York, Maryland and New Jersey, although GTM Research does note that the residential market continues to diversify, with the market shares of states outside the top 10 increasing from 16% in 2016 to 21% in 2017.
There are many factors for the decline, which pv magazine has covered in detail. GTM Research notes changes to net metering policies, the pull-back from national installers Tesla/SolarCity and Vivint Solar, customer acquisition challenges and even rain – in short, the perfect storm.
In addition the the contraction in the residential market, the U.S. utility-scale market also saw a decline. And while it has long been anticipated that the market would have a hangover after the frenzied build-out in 2016 to meet the anticipated drop-down of the federal Investment Tax Credit (ITC), the 41% fall in this segment was worse than expected.
GTM Research and SEIA blame “delays and consequent spillover of projects into 2018” due to the Section 201 tariffs, as well as delays and cancellation of projects with contracts secured under the auspices of the Public Utilities Regulatory Policy Act of 1978 (PURPA). Changes to PURPA were particularly severe in Idaho and Montana, but a number of states changed PURPA implementation.
This includes North Carolina, which emerged as the second-largest state market after California, and the only one of the top three markets to grow from 2016 to 2017. Despite a move away from standard contracts under PURPA to an auction system, North Carolina’s solar market appears to be alive and well.
And in sharp contrast to the malaise in both the residential and utility-scale markets, the “non-residential” segment, where GTM Research puts commercial and industrial, non-profit, government and even community solar, grew 28% year-over-year to 2.1 GW. The report credits much of this to demand “pull-in” preceding policy changes in California, Massachusetts and New York, as well as the growth of community solar in Minnesota where 246 MW came online last year.
When all three segments are combined, the volume of the U.S. solar market fell 30% last year. However, it was still 41% larger than 2015. This indicates that the boom in 2016 was the outlier in the overall trend, not the market volume last year.
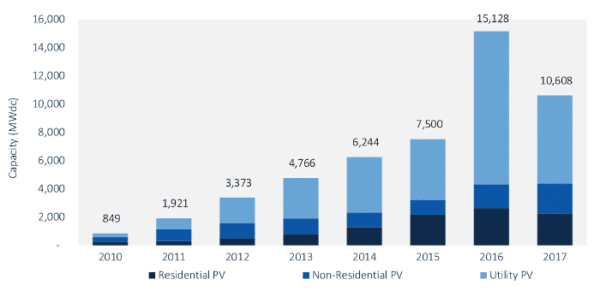
Image: Wood Mackenzie, Limited/SEIA U.S. Solar Market Insight
Federal policy headwinds
Market segments only tell part of the story of an industry that struggled last year with policy changes both at the federal in addition to the state level. U.S. President Donald Trump’s 30% tariffs on imported PV cells and modules led to a market slow-down, particularly in the utility-scale segment, as well as increase prices and shortages of modules during the second half of the year.
The effects of the other major federal policy change last year, tax reform, has yet to be fully understood. While the Base Erosion Anti Abuse Tax (BEAT) provision is looking to have less of an impact on tax equity finance than initially feared, the reduction in the corporate tax rate could affect the supply and price of tax equity finance.
Moving forward, the drivers for the utility-scale market are beginning to shift as costs fall further. With utilities in California and other states over-supplied relative to state renewable energy mandates, GTM Research and SEIA estimate that voluntary procurement will continue to be the primary driver of new demand, driving 1/3 of large-scale PV demand.
Thanks to multi-year development timelines, visibility into the utility-scale market is better than the other segments, and GTM Research and SEIA reports 16.9 GW of utility-scale solar projects with signed power contracts, 2.3 GW of which is currently under construction.
Ultimately, all of this is driven by falling costs. And while the report finds that the Section 201 trade case drove module prices up 20% in the second half of the year to $0.48 per watt, prices for both non-residential and utility-scale systems still fell slightly year-over-year, due to cost reductions in other categories.
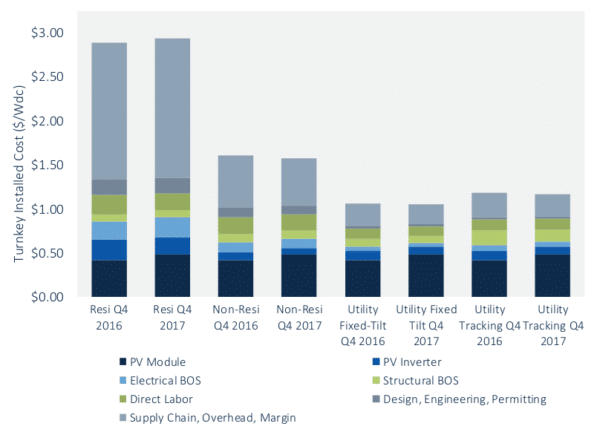
Image: Wood Mackenzie, Limited/SEIA U.S. Solar Market Insight
With the worst case of federal policy impacts largely averted, the report expects relatively flat installation volumes in 2018, with another 10.6 GW installed. GTM Research and SEIA further expect the market to being to rise again slowly in 2019, to reach over 15 GW annually by 2023.
This content is protected by copyright and may not be reused. If you want to cooperate with us and would like to reuse some of our content, please contact: editors@pv-magazine.com.


By submitting this form you agree to pv magazine using your data for the purposes of publishing your comment.
Your personal data will only be disclosed or otherwise transmitted to third parties for the purposes of spam filtering or if this is necessary for technical maintenance of the website. Any other transfer to third parties will not take place unless this is justified on the basis of applicable data protection regulations or if pv magazine is legally obliged to do so.
You may revoke this consent at any time with effect for the future, in which case your personal data will be deleted immediately. Otherwise, your data will be deleted if pv magazine has processed your request or the purpose of data storage is fulfilled.
Further information on data privacy can be found in our Data Protection Policy.