Researchers have found that historic projections of solar and energy storage costs have consistently underestimated the pace of price declines. In the study Are we too pessimistic? Cost projections for solar photovoltaics, wind power, and batteries are over-estimating actual costs globally, the authors reveal that about half of 2050 cost projections are already on par with today’s prices.
One particularly gobsmacking finding: some 2050 forecasts for utility-scale solar capital expenditures (CAPEX) overshoot today’s market prices by 30%.
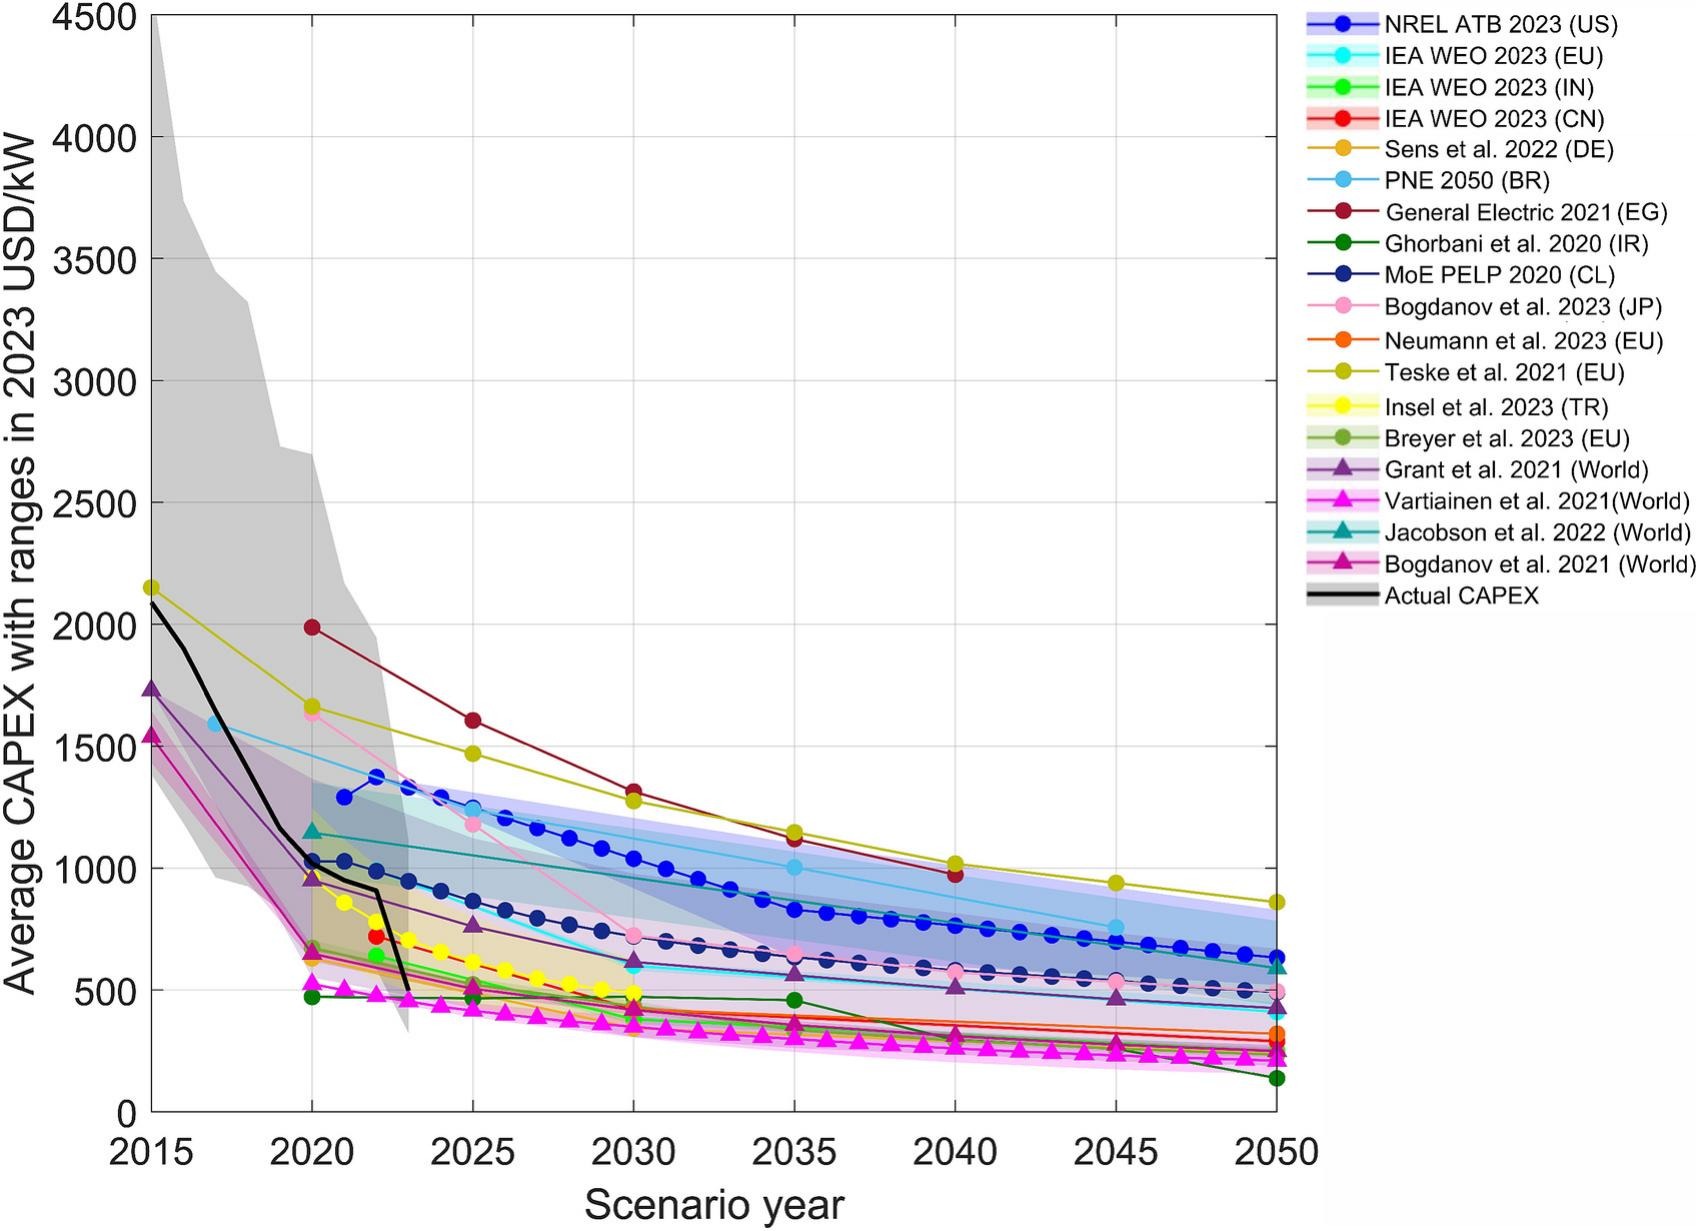
In the chart below, the solid black line labeled “Actual CAPEX” represents 2023 values of roughly $500/kW. The surrounding projection lines, which stretch to 2050, show that half of the studies forecast prices above that level, and half below.
It has long been a running joke in the solar industry that the International Energy Agency (IEA) repeatedly underestimates global solar growth. There’s even a now-famous chart lampooning a decade of missed IEA forecasts. The agency’s chronically befuddled outlook reflects its long-standing historical alignment with legacy energy sectors: oil, gas, and coal.
But even within the solar sector, there’s a tendency to temper expectations. Forecasters often strive to appear measured and mature, sometimes to a fault. Wood MacKenzie is known for publishing cautious solar projections, only to revise them upward the following year. BloombergNEF tends to get the trajectory right but still undershoots on volume, with first-quarter forecasts averaging about 10% below actual deployment since 2011.
In Are we too pessimistic?, the researchers compare hardware pricing and levelized cost of electricity (LCOE) projections from 40 studies and 150 scenarios across utility-scale solar photovoltaics, rooftop solar, onshore and offshore wind, and lithium-ion batteries.
As the chart above shows, a few studies managed to track the decline in utility-scale solar prices from 2020 to 2022, but none foresaw the steep plunge that followed the collapse in polysilicon prices as COVID-era supply chains recovered.
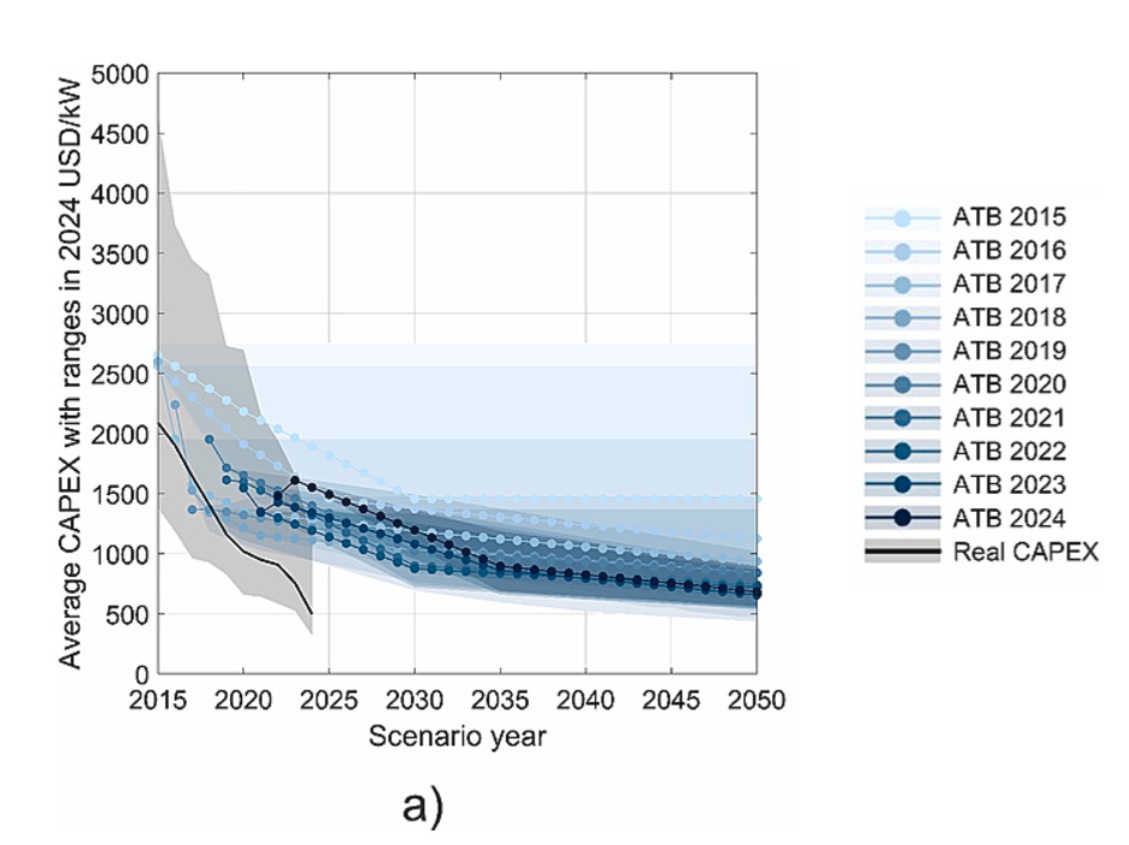
One example of this widening “Overton pricing window” comes from the U.S. Department of Energy’s National Renewable Energy Laboratory (NREL), which houses some of the most respected solar experts in the country.
The 2015 ATB report from the NREL estimated the average LCOE for utility-scale PV to be $91/MWh (2024 USD) in the year 2050. Conversely, the latest report from 2024 anticipated an average of $21/MWh (2024 USD) for the same year, a 77% reduction.
In a separate section, the authors cite similar shifts in projected CAPEX:
The 2015 ATB estimated the average CAPEX for utility-scale PV to be $1500/kW (2024 USD) in the year 2050. Conversely, the latest report from 2024 anticipated an average of $700/kW (2024 USD) for the same year, a 53% cost reduction.
That’s more than a 50% drop in the capital required to deploy smarter, longer-lasting hardware, alongside a 77% reduction in its projected cost of electricity. In both cases, long-range projections meant to stretch across 35 years were met and surpassed in less than 10.
For lithium-ion batteries, the story is similar, except we’re still in the steepest and most exciting part of the price declines.
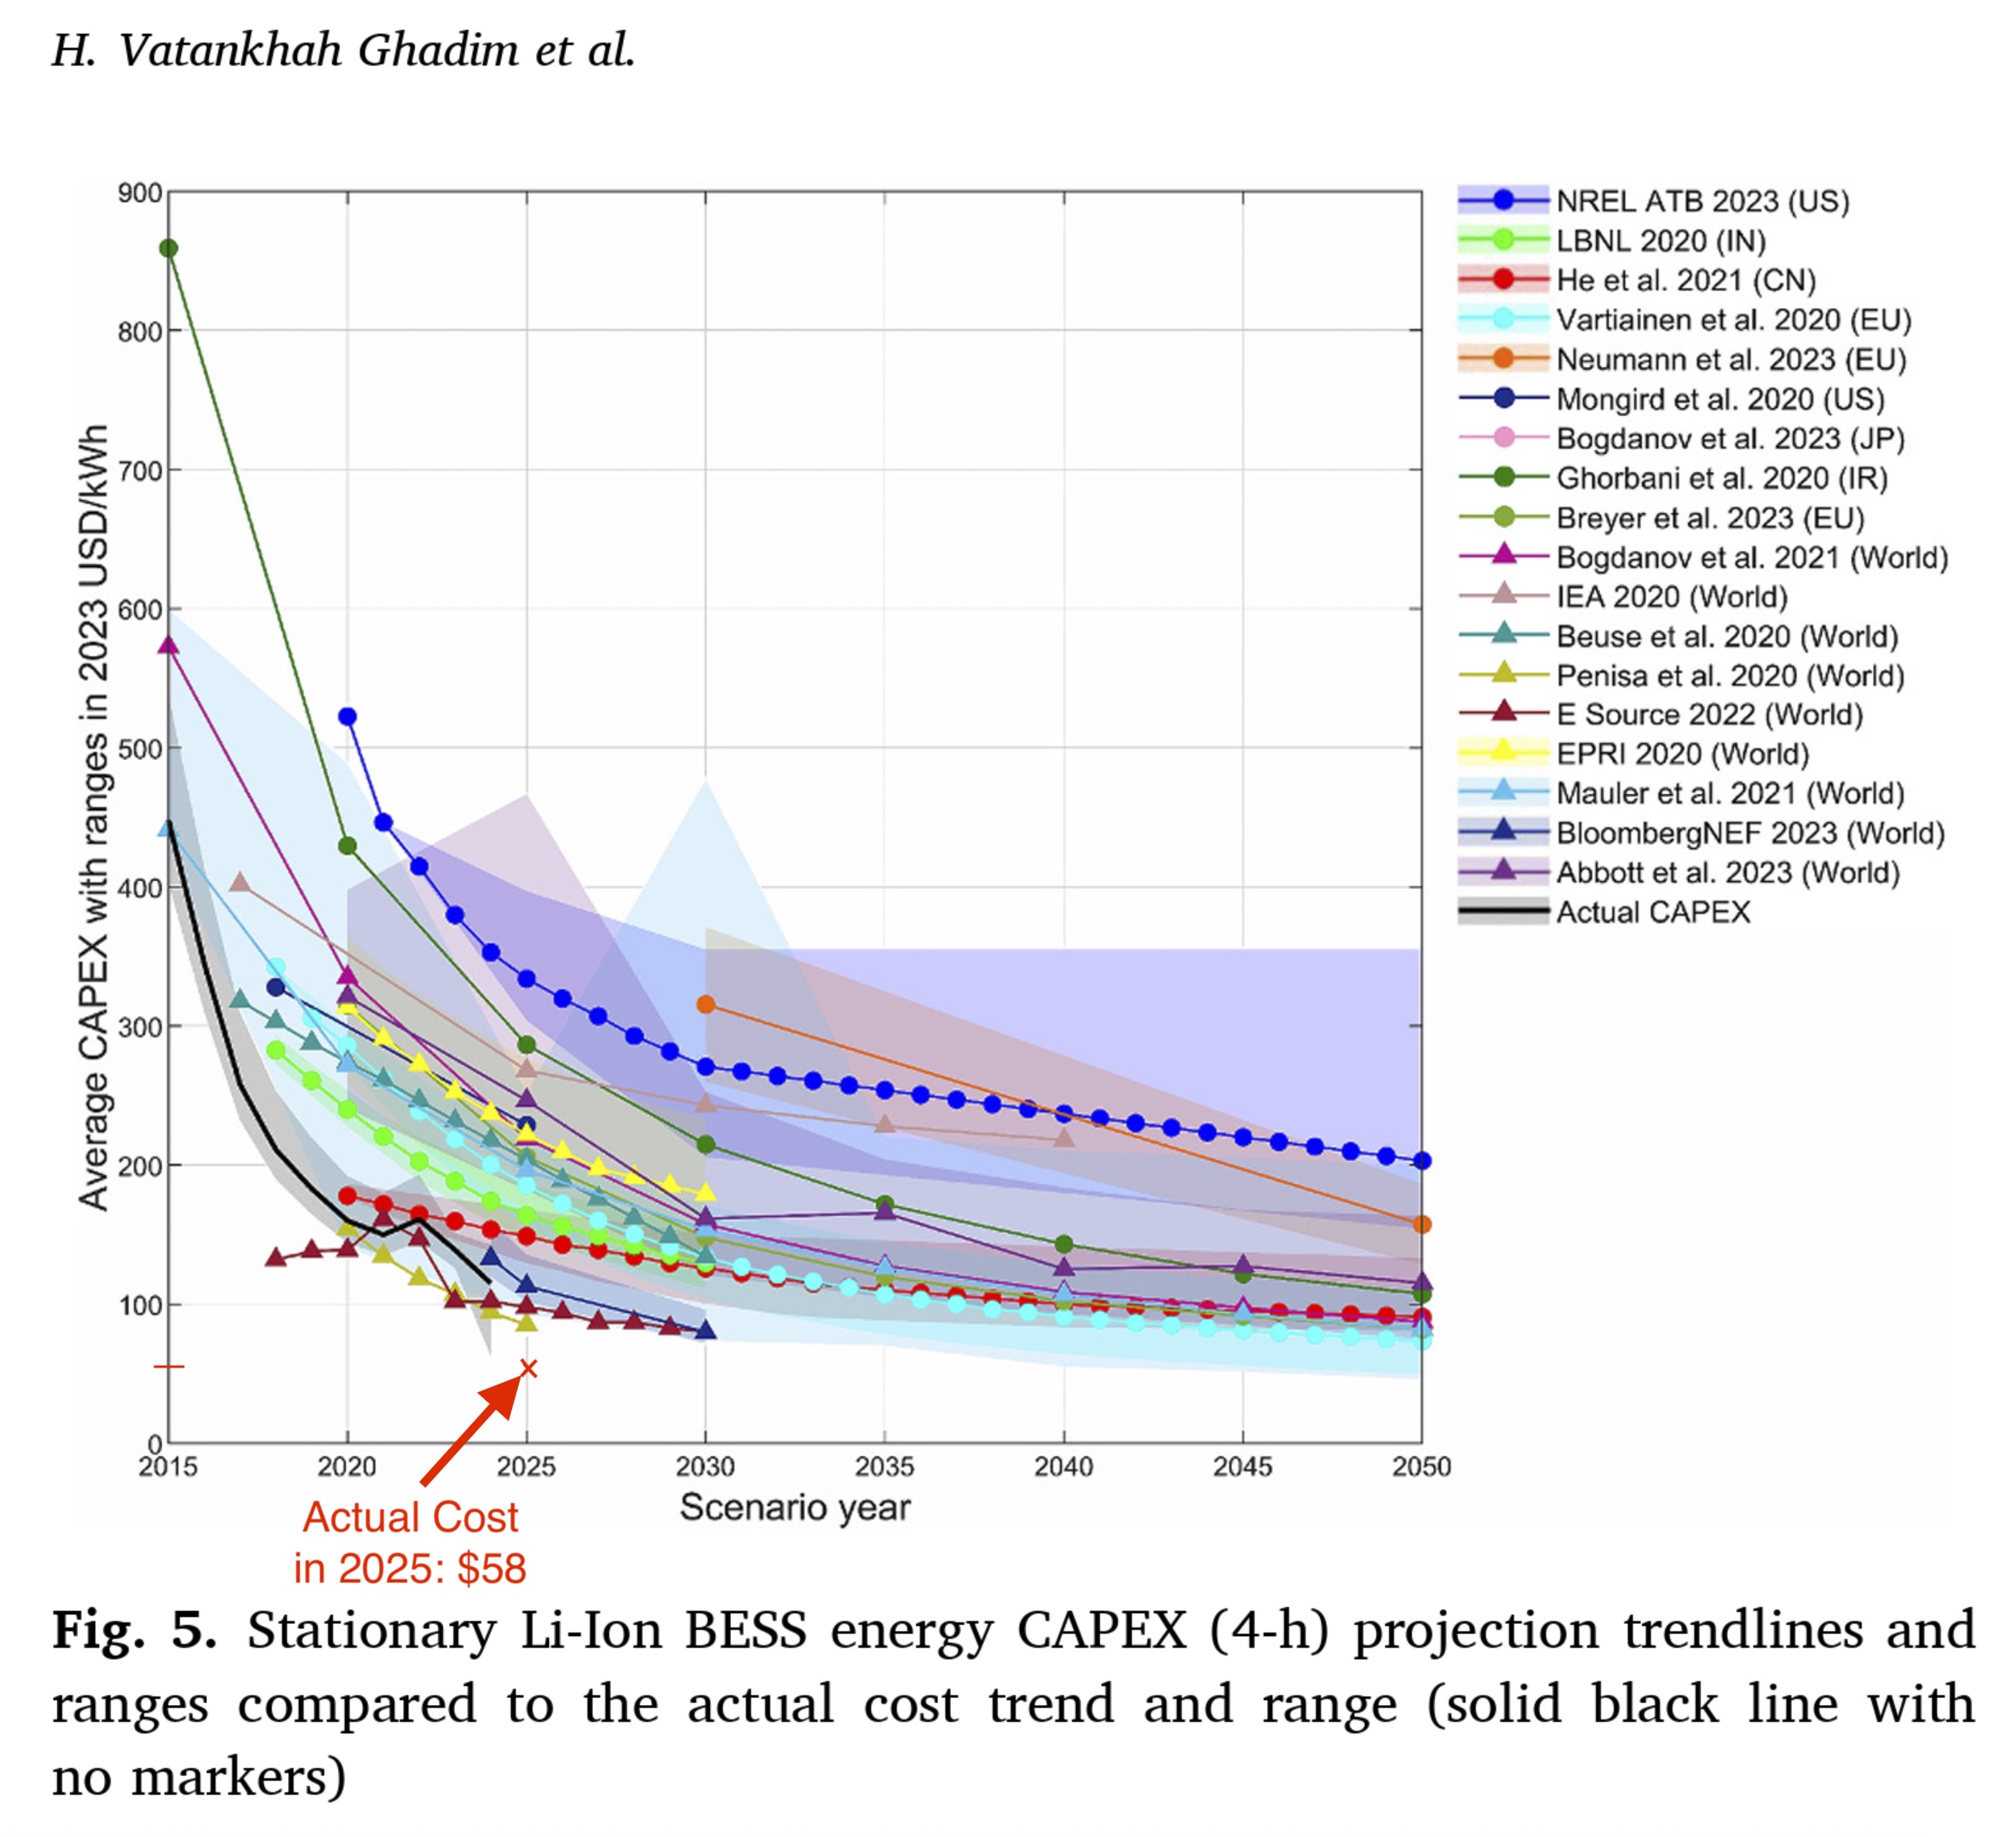
The chart above shows that projections for lithium-ion storage in the 2010s quickly fell behind reality. Prices dropped from $450/kWh to around $175/kWh by 2020, while the most optimistic projections still placed costs around $250/kWh. The data, collected through 2024, show that real-world price declines continue to outpace forecasts.
As usual, long-range forecasts tend to flatten out. Most 2050 forecasts cluster across a wide range of $60-$360/kWh, even though recent bids for near-term projects are already coming in at or below $60/kWh.
It’s tempting to assume that these steep price declines must slow soon. But that assumption keeps being wrong.
How much solar power will be installed in 2025? What about 2026? Despite growing evidence of rapid acceleration, many forecasts continue to lowball solar’s trajectory. The IEA once claimed 600 GW of solar per year was needed to meet climate goals—a target that was met last year. Bloomberg initially projected 700 GW for 2025 but has since revised that number upward. Some analysts now believe global installations could reach 1 TW next year, though caution still prevails in many models.
Efficiency gains may soon become the dominant path to lower LCOE. Li Zhenguo, founder and former CEO of Longi Green, sees the potential for perovskite-silicon tandem cells to reach 44% efficiency. He also noted that every 1% increase in module efficiency results in roughly a 5% reduction in LCOE.
To put that in context: if a 2022 LCOE for utility-scale solar was around $50/MWh using panels with around 22% efficiency, a shift to 43% efficient tandem modules could push LCOE down to $17/MWh.
This content is protected by copyright and may not be reused. If you want to cooperate with us and would like to reuse some of our content, please contact: editors@pv-magazine.com.


By submitting this form you agree to pv magazine using your data for the purposes of publishing your comment.
Your personal data will only be disclosed or otherwise transmitted to third parties for the purposes of spam filtering or if this is necessary for technical maintenance of the website. Any other transfer to third parties will not take place unless this is justified on the basis of applicable data protection regulations or if pv magazine is legally obliged to do so.
You may revoke this consent at any time with effect for the future, in which case your personal data will be deleted immediately. Otherwise, your data will be deleted if pv magazine has processed your request or the purpose of data storage is fulfilled.
Further information on data privacy can be found in our Data Protection Policy.