In January 2025, solar electricity output grew 42% year-over-year, as photovoltaics contributed more than 5% of all U.S. electricity for the middle of winter month. This boost follows nearly 90 GW of freshly installed capacity across 2023 and 2024, much of it at utility scale, and represents a 35% jump in solar’s share of all electricity compared to the prior year.
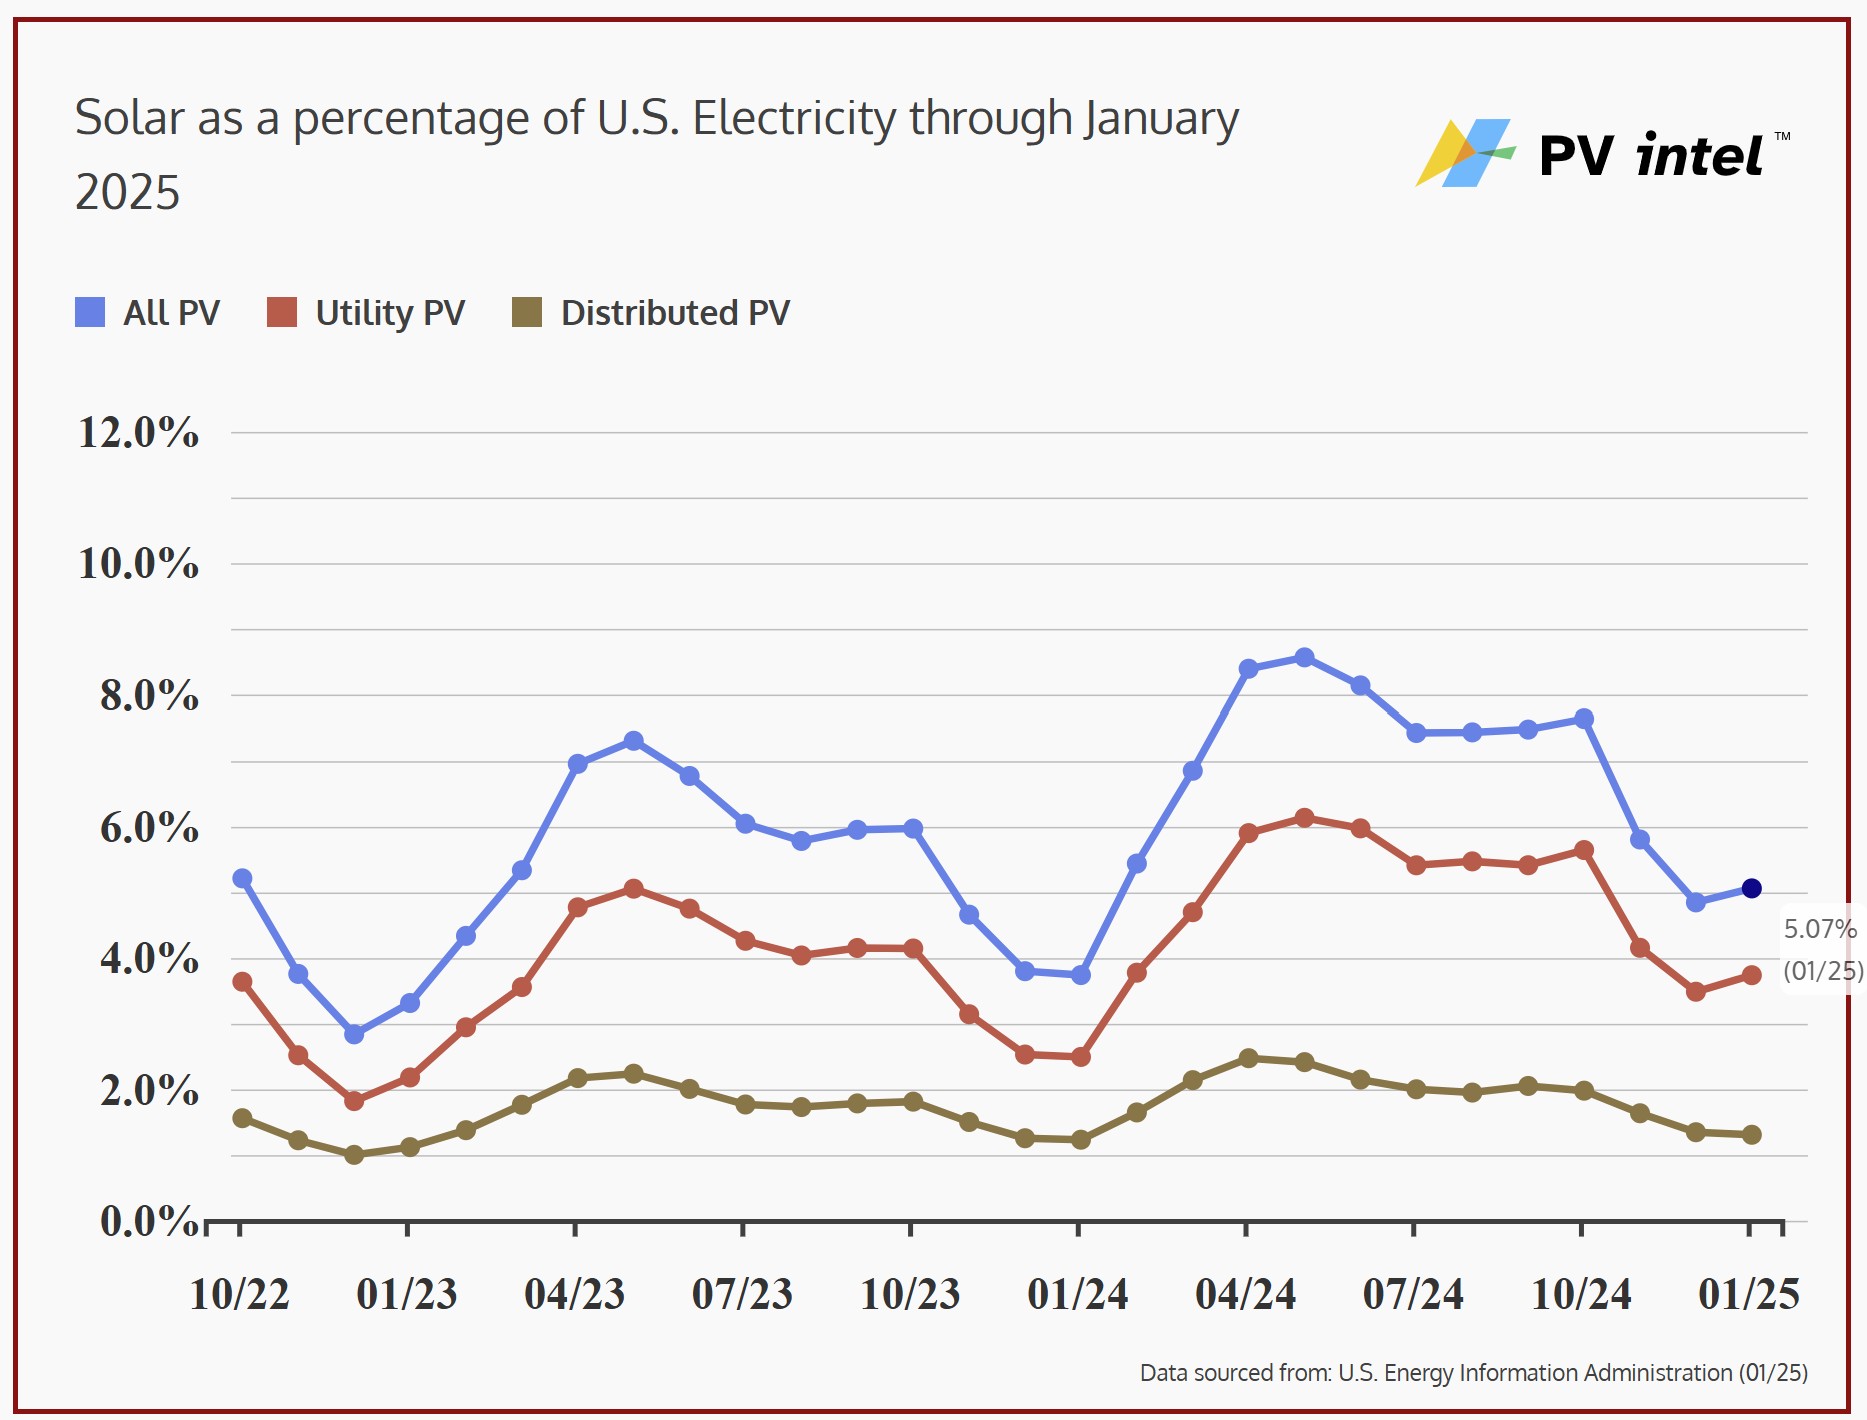
Data from the Electric Power Monthly, published by the U.S. Department of Energy’s Energy Information Administration (EIA), and processed by PV Intel, also indicates a significant uptick in utility-scale solar generation. Large-scale solar output grew from just over 9.6 TWh to more than 15.2 TWh, which was a 58% year-over-year jump.
The EIA estimates distributed solar generation grew by about 12%. This aligns with distributed solar capacity expanding by approximately 8 GW, which was about 11% lower than 2023’s total. Meanwhile, utility-scale solar installations rose from roughly 32 GW in 2023 to 42 GW in 2024.
Despite this substantial solar expansion, electricity demand also increased. Total generation for the first month of 2025 was up 5.6%, reaching just over 406 TWh, compared to 385 TWh in 2024. This rising load could inhibit the grid’s ability to fully decarbonize. For all of 2024, electricity demand was up just over 3%.
Even so, clean power sources made progress. While combined wind and solar output did not grow significantly in 2023, wind and solar made measurable gains in the past 12 months.
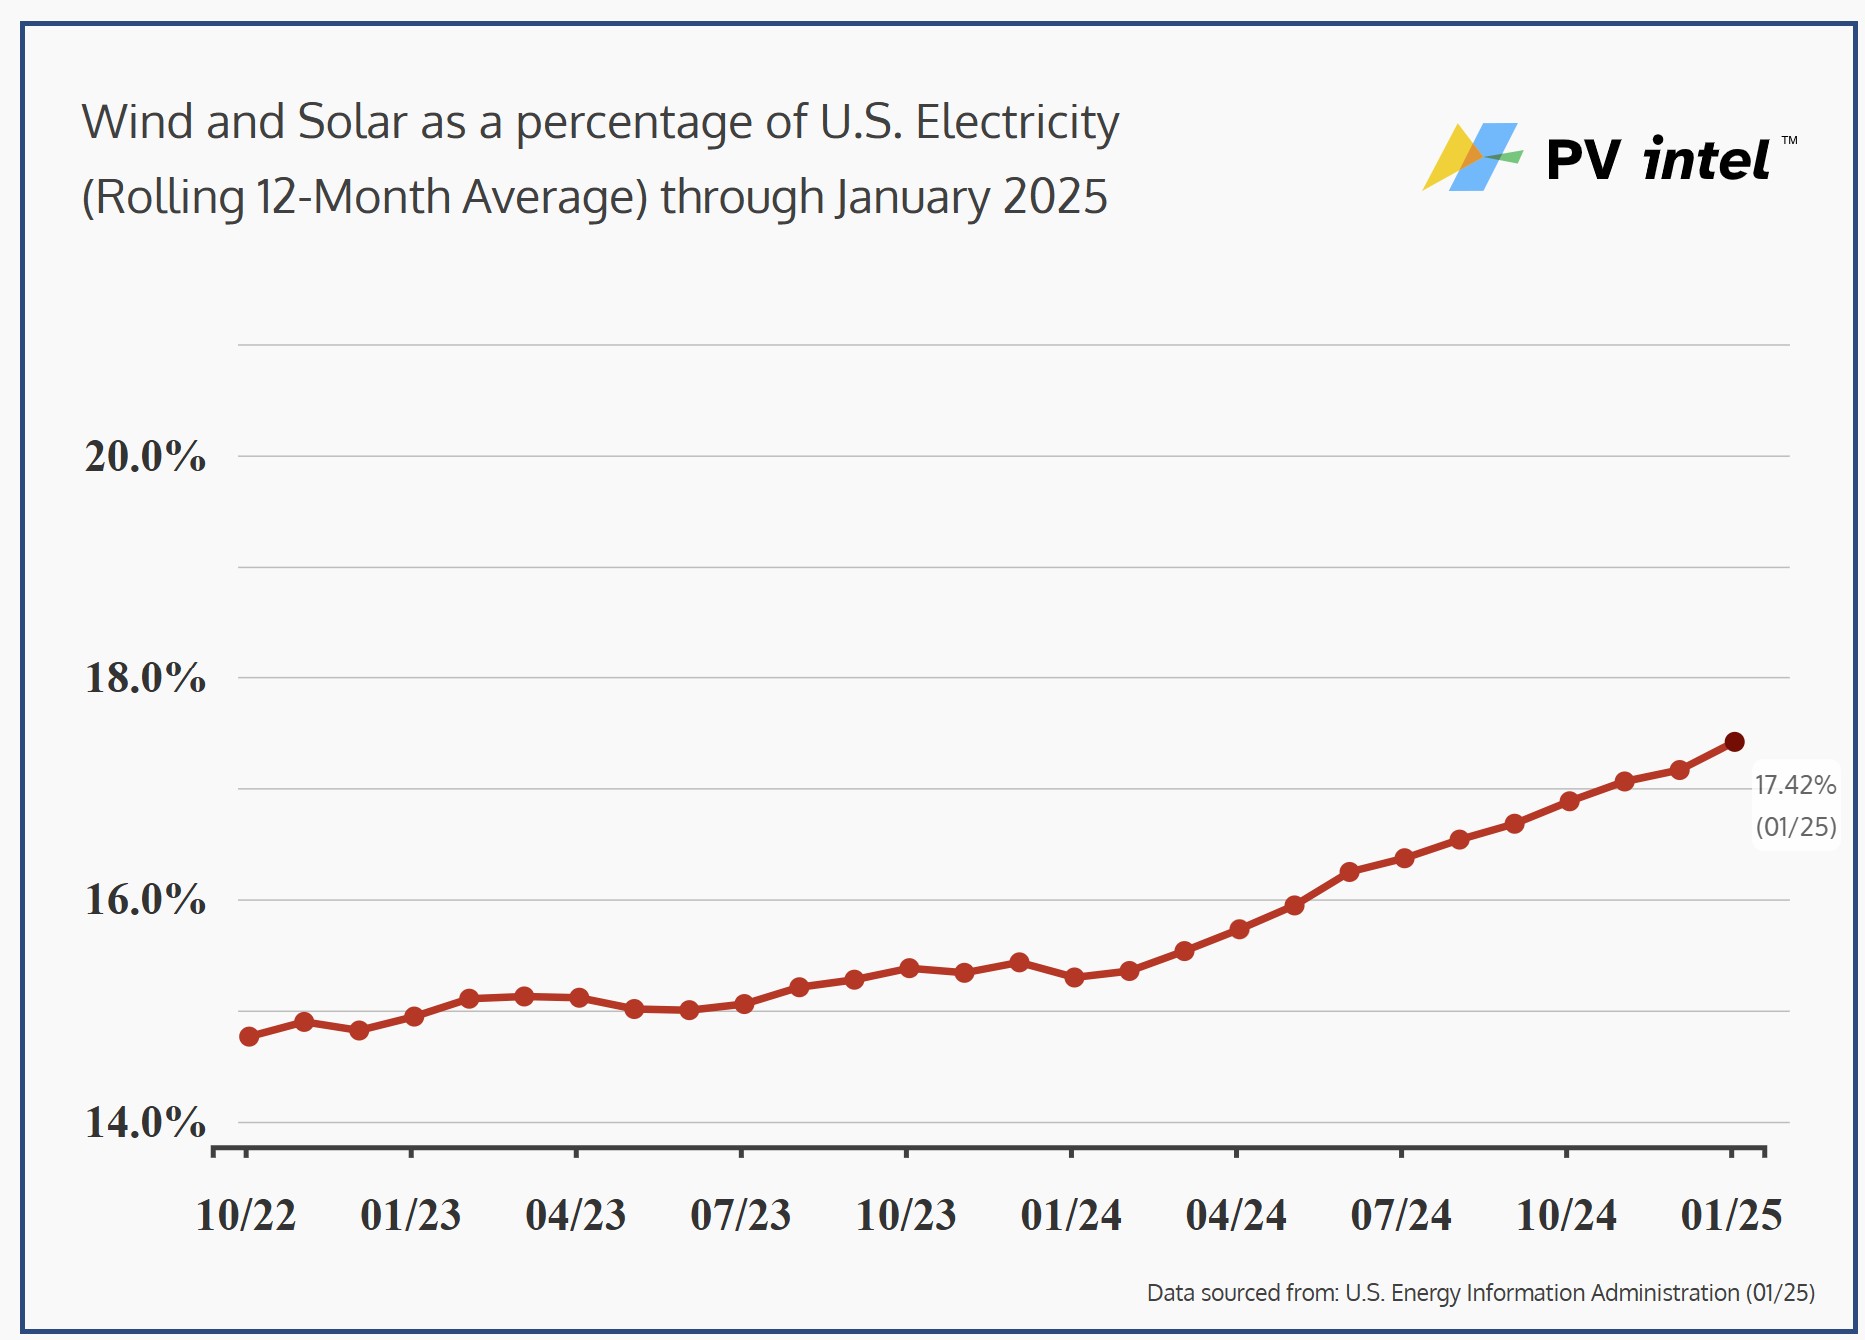
In the latest 12-month period, wind and solar together delivered just over 17.4%. This is an absolute increase of just over 2% versus the prior 12-month period ending January 2024, in which the combo delivered 15.3% of all electricity.
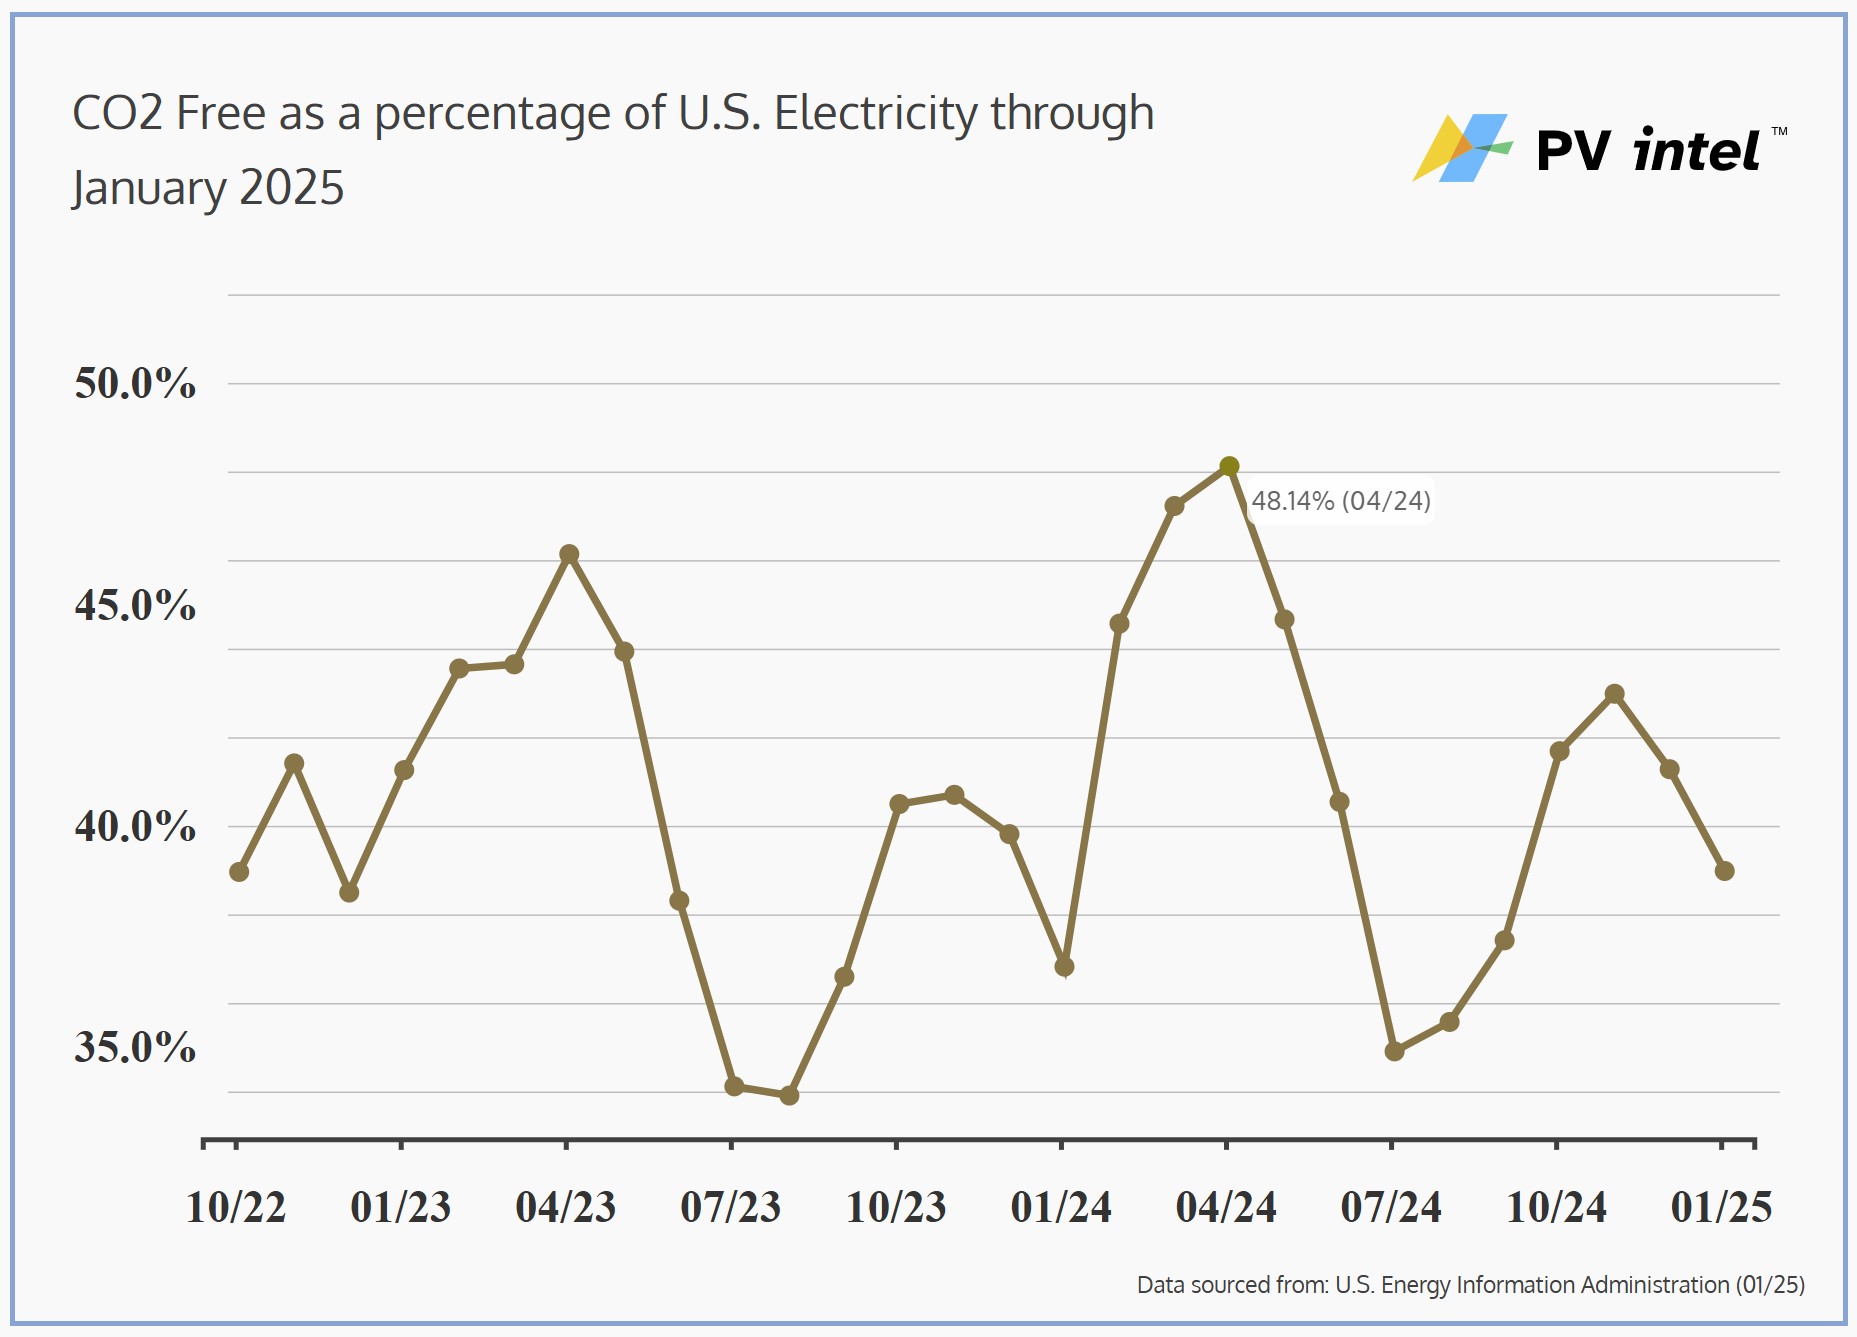
Bolstered by continuing solar growth, plus new wind installations and a new nuclear facility that came online in 2024, it is now plausible that emission-free electricity could surpass 50% of generation this April.
April 2024’s emission-free generation – the peak clean month of the year on the U.S. power grid – was just over 48% of the total. With a more than 2% absolute increase from wind and solar since then, that share could carry forward through the end of April to push emission-free sources past the halfway mark.
The 50% mark may even have been crossed last month, but we won’t know until the next EIA report.
Adding momentum, solar power became the second-largest utility-scale electricity source in the United States for brief periods in late March. For example, on March 25 at 3 p.m. EST, the EIA’s nearly real-time Hourly Electric Grid Monitor showed solar generating just over 91 GW. This trailed only fossil gas, at 138 GW, and exceeded nuclear’s 80 GW.
If electricity demand continues to grow at the 5.6% rate seen in January, however, sustaining that 50% threshold in the coming months could still prove challenging.
This content is protected by copyright and may not be reused. If you want to cooperate with us and would like to reuse some of our content, please contact: editors@pv-magazine.com.


By submitting this form you agree to pv magazine using your data for the purposes of publishing your comment.
Your personal data will only be disclosed or otherwise transmitted to third parties for the purposes of spam filtering or if this is necessary for technical maintenance of the website. Any other transfer to third parties will not take place unless this is justified on the basis of applicable data protection regulations or if pv magazine is legally obliged to do so.
You may revoke this consent at any time with effect for the future, in which case your personal data will be deleted immediately. Otherwise, your data will be deleted if pv magazine has processed your request or the purpose of data storage is fulfilled.
Further information on data privacy can be found in our Data Protection Policy.