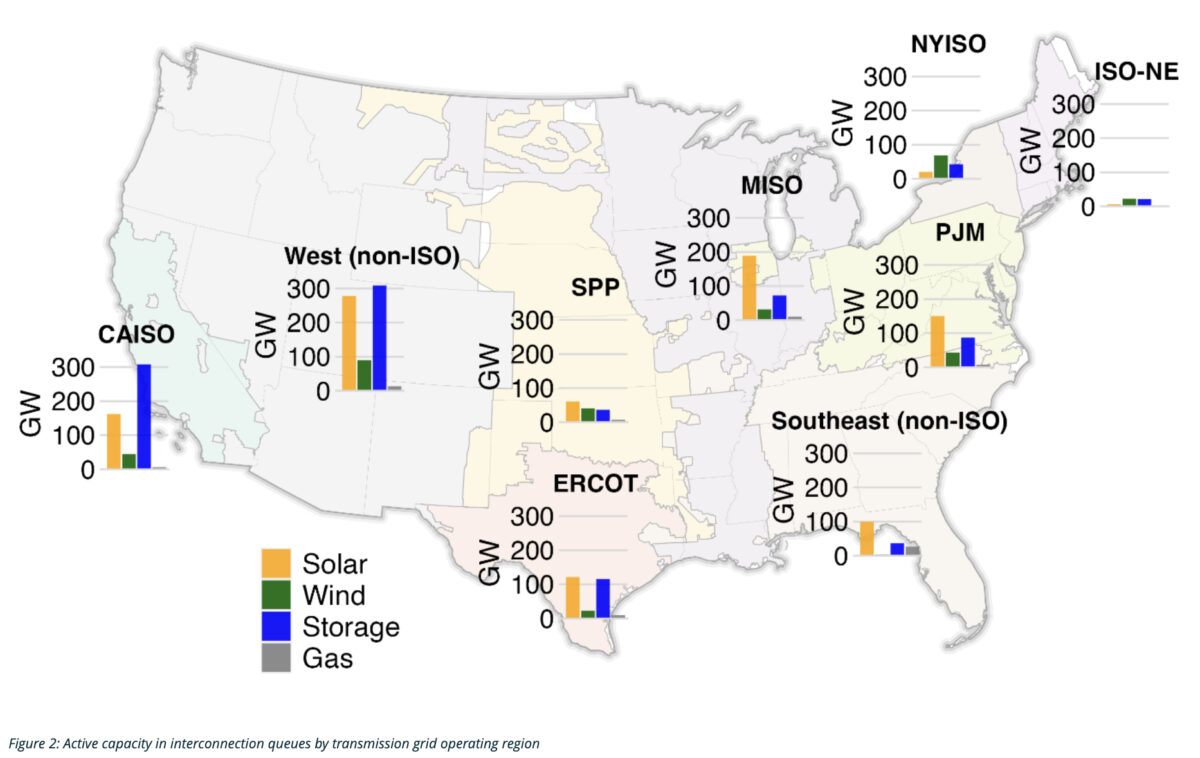
A research report from Lawrence Berkeley National Laboratory found that 1,080 GW of solar projects and about 1,030 GW of storage projects await interconnection studies, so they may connect to the transmission grid.
Solar and battery storage accounted for over 80% of new capacity entering the queues in 2023, driving a 30% increase in the waiting lists, known as queues, for interconnection studies.
Storage capacity in the queues grew more than 50% last year. Over half of the battery storage capacity in the queues is paired with some form of generation, typically solar. Wind capacity in the queues rose to 366 GW, while only 79 GW of fossil gas and 2 GW of coal capacity await interconnection studies.
The values were nearly the same as preliminary values published last month in a staff report from the Federal Energy Regulatory Commission (FERC).
The growing backlog of projects awaiting grid interconnection studies “has become a major bottleneck” for project development, the study said, as proposed projects are “mired in lengthy and uncertain” interconnection study processes. Based on past experience, the study said that “most interconnection requests are ultimately cancelled and withdrawn,” while projects that are built are taking longer on average to reach commercial operation.
Although FERC adopted major interconnection reforms in 2023, the study says most reforms “have not yet taken effect in most regions, with project developers continuing to cite grid interconnection as a leading cause of project delays and cancellations.”
The authors pointed to other project development stages beyond submitting an interconnection request, and then waiting for the grid operator to complete interconnection studies, saying that “projects must also have agreements with landowners and communities, power purchasers, equipment suppliers, and financiers, and may face transmission upgrade requirements.”
Even so, the authors said that data from the queues provides a “general indicator for mid-term trends” in power sector activity and energy transition progress.
Berkeley Lab compiled and analyzed data from the seven organized electricity markets in the U.S. known as RTOs and ISOs, and an additional 44 balancing areas outside of RTOs and ISOs, which together represent over 95% of currently installed U.S. electricity generation.
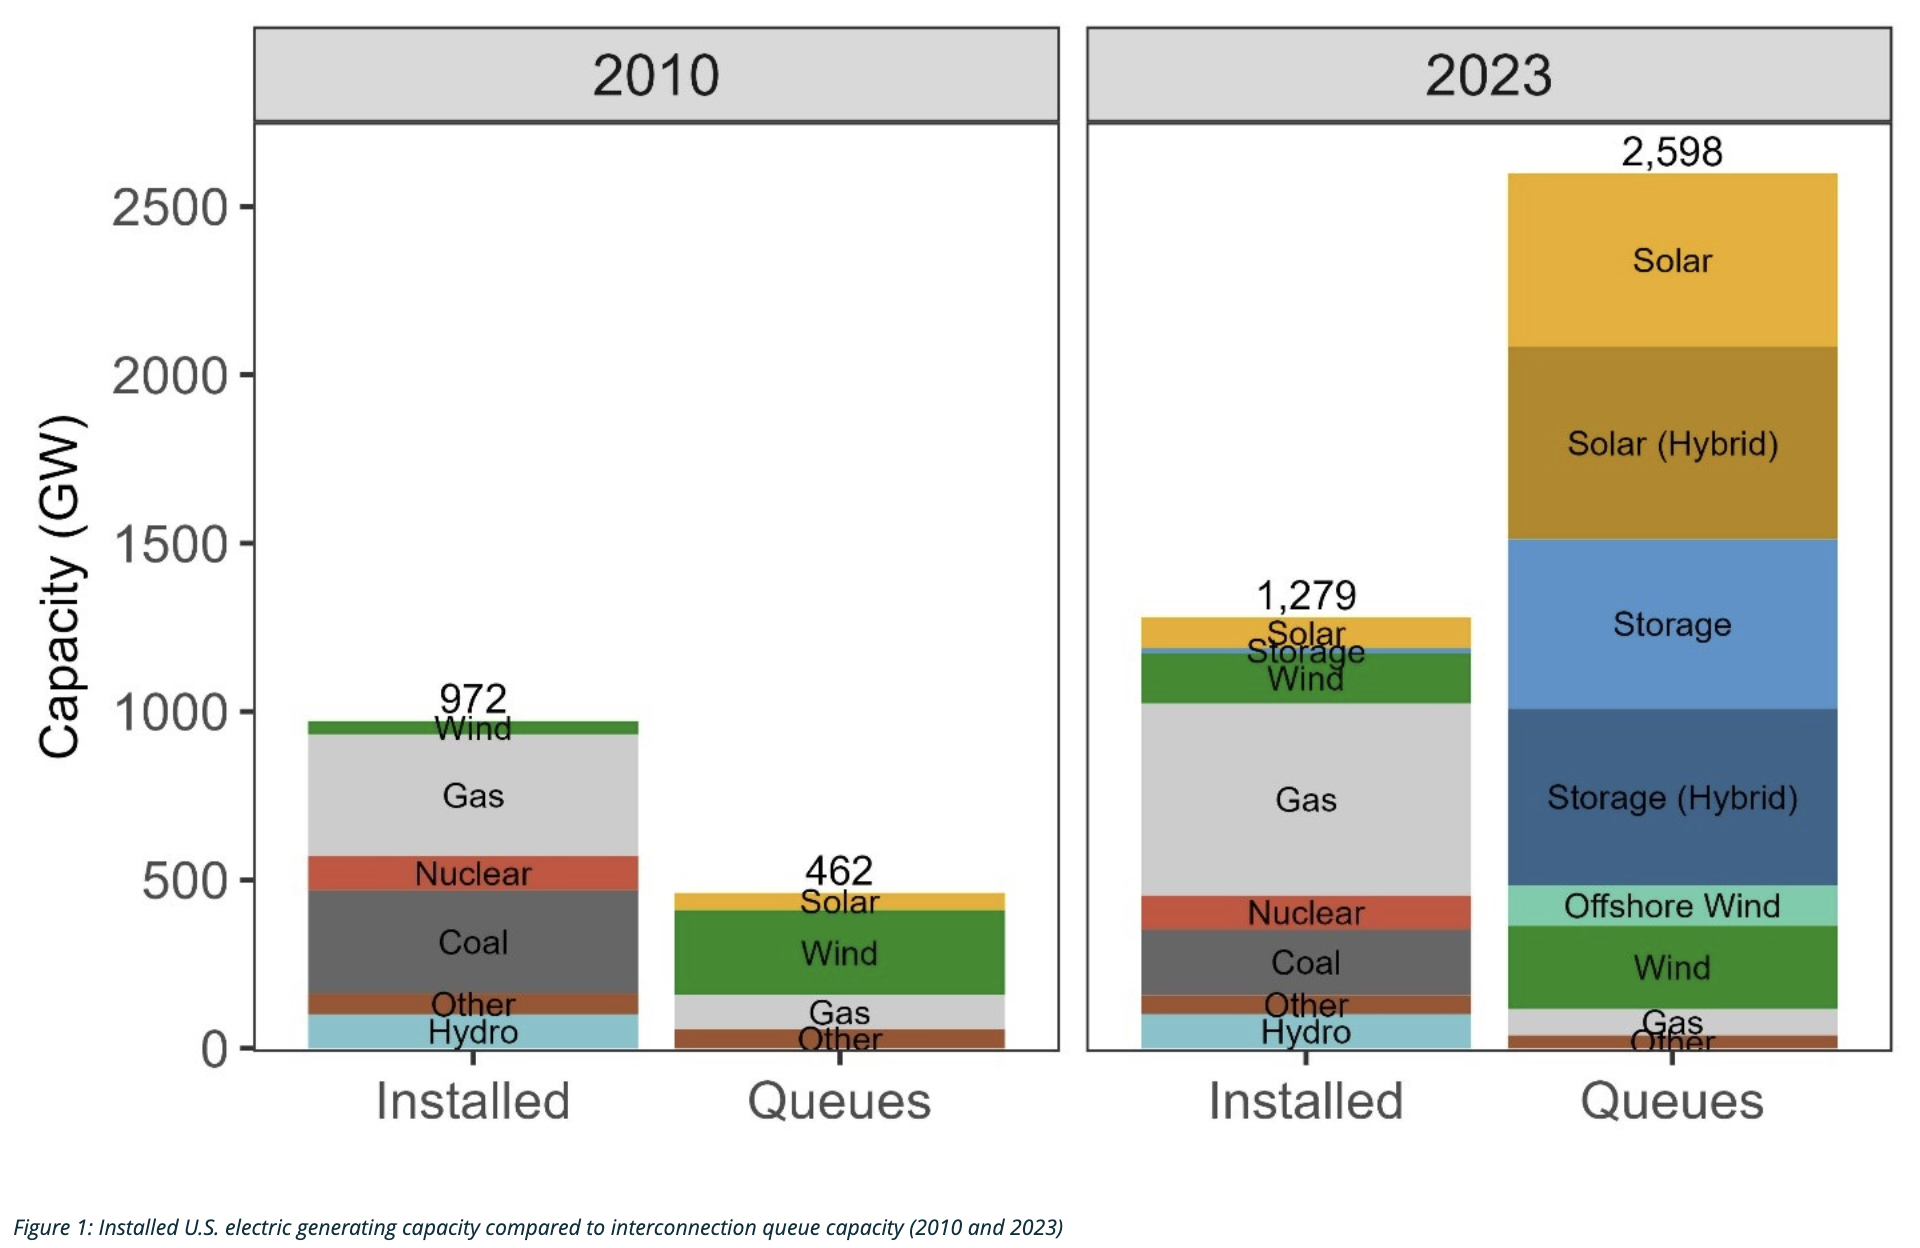
Total generation plus storage capacity in the queues at year-end 2023 equaled 2.6 terawatts, as shown in the image below, which the authors noted is about eight times larger than the interconnection queue in 2014, and more than twice the current U.S. generating capacity of 1.28 TW.
Berkeley Lab has made available a study abstract, an overview and slide deck, an interactive visualization of the queue data, interactive maps and a data file.
The study’s authors will host a webinar to describe the research and answer questions on April 23 at 1 p.m. Eastern time.
This content is protected by copyright and may not be reused. If you want to cooperate with us and would like to reuse some of our content, please contact: editors@pv-magazine.com.


By submitting this form you agree to pv magazine using your data for the purposes of publishing your comment.
Your personal data will only be disclosed or otherwise transmitted to third parties for the purposes of spam filtering or if this is necessary for technical maintenance of the website. Any other transfer to third parties will not take place unless this is justified on the basis of applicable data protection regulations or if pv magazine is legally obliged to do so.
You may revoke this consent at any time with effect for the future, in which case your personal data will be deleted immediately. Otherwise, your data will be deleted if pv magazine has processed your request or the purpose of data storage is fulfilled.
Further information on data privacy can be found in our Data Protection Policy.