The perennial top three countries – China, the United States, and India – continue to account for some two-thirds of global utility scale solar generation capacity. Look beyond those simple totals, however, and you find some impressive relative results by many of those countries in the remaining one-third.

From Wiki-Solar’s comprehensive database of more than 22,000 utility scale solar projects around the world, it is possible to derive a wide range of comparators, including site performance ratios, average yield, and land utilization. This article looks at national achievements and rates of progress.
Solar contribution
Firstly, we have assessed the nominal annual output of the large solar capacity in each country and compared it with national electricity consumption. On that basis, five countries now meet more than 10% of their electric power demand from utility scale solar. Most of these figures would be significantly higher if rooftop and other small scale solar arrays were factored in.
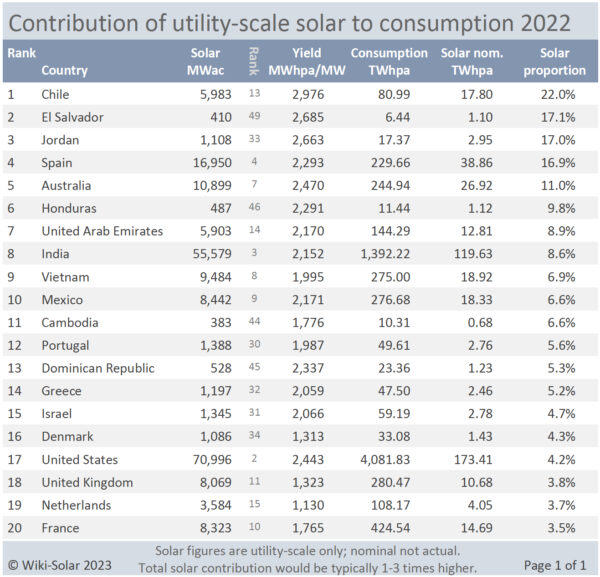
Chile tops the list, thanks in part to its exceptional yield from so many high-altitude desert sites. El Salvador and Jordan feature strongly, with solar contributing substantially to their more modest electricity demand. Spain carries the banner for Europe while Australia has progressed strongly after a slow start.
The UAE owes much of its elevated position to a single huge project, the Mohammed Bin Rashid Al Maktoum Solar Park in Dubai. India may be only number three, in terms of total generation capacity, but leads the United States and China in relative terms, with 8.6% of its electricity from utility scale solar, and 13.2% from overall solar capacity.
An extended list which shows most of the countries with significant utility scale solar capacity is available on the Wiki-Solar website. There you will find Germany, with 3.2% of its electricity demand met by big solar, a few places above China, which sits at number 29, with 2.6%
Leading contenders
The rate of progress is another key indicator. We have evaluated this by looking at the change over the five-year period from 2017 to last year.
For comparison, we have extended this rate forward until utility scale solar would meet 100% of electricity demand. This is, of course, a theoretical exercise. No nation would, in practice, generate all of its power this way and neither the growth of solar nor the trend in electricity consumption will continue as a straight line. The results of the exercise are, nonetheless, illuminating.
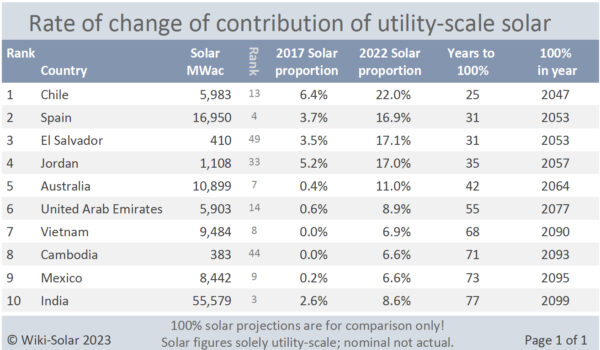
Chile again tops the list and would need just 25 years to achieve that notional 100% utility scale solar coverage. Spain has seen outstanding renewed growth in recent years, taking it to number two on this list, with El Salvador and Jordan not far behind. In theory, the top ten countries for solar progress would all reach 100% solar, from utility-scale alone, before the end of the century.
Again, the full list is available online and features a strong European contingent – Portugal, Greece, the Netherlands and Denmark – just outside the top ten. Some countries where recent progress in utility scale solar has been slow would need several centuries to reach 100%, by this measure.
The large solar power stations we are considering here are not, of course, for individuals or households. Another measure of comparative achievement is relative solar generation capacity per person.
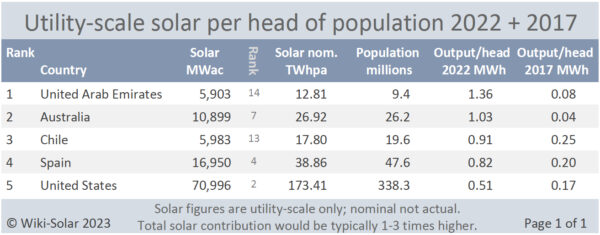
Inevitably this is quite similar to the first table above but this time the UAE and Australia leapfrog Chile. The United States has a much higher ranking in this table because its power consumption per capita – from all generation sources – is substantially higher than most other nations. Again, the full table is available online.
The land question
Wiki-Solar has accurate site footprints for the majority of utility scale plants, enabling us to assess the land area typically used for big solar sites in different parts of the world. When this number is related to the land area of each country, it is no surprise to find that land usage is seldom an issue.
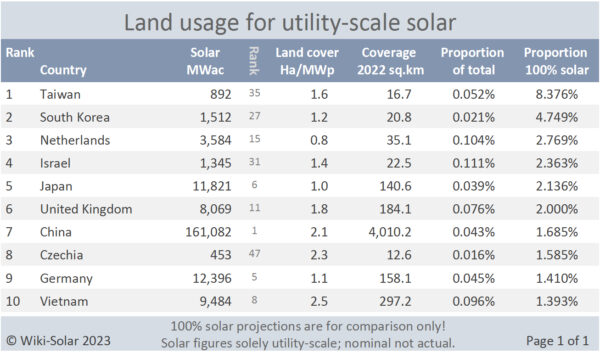
The most that any country currently devotes to utility scale solar is just over one tenth of 1%. Only two, relatively small and energy intensive countries – Taiwan and South Korea – would need to allocate more than 3% of their land for PV, even to achieve the theoretical 100% solar paradigm.
The full list shows the United States down among the countries that would need to devote around 0.5% of total surface area for 100% solar. The use of building-mounted systems and the growth of agrivoltaics, of course, means that the land allocated can also be productive for other purposes.
Disclaimer
The expression “nominal output” refers to the design or expected annual output of solar power stations. Actual output in practice will vary with solar radiation and other climatic and site factors, such as grid constraints.
The 100% solar paradigm is used for illustrative and comparative purposes. A 100% renewables scenario featuring wind, hydro, and biomass alongside solar is more realistic.
National power consumption figures are mainly taken from French data company Enerdata and the International Energy Agency; population data is mainly taken from the United Nations. Utility scale solar figures come from the Wiki-Solar database. For consistency, generation capacity is quoted in MW/TW (AC) to enable direct comparison between PV and concentrating solar power plants and other forms of generation.
The views and opinions expressed in this article are the author’s own, and do not necessarily reflect those held by pv magazine.
This content is protected by copyright and may not be reused. If you want to cooperate with us and would like to reuse some of our content, please contact: editors@pv-magazine.com.


By submitting this form you agree to pv magazine using your data for the purposes of publishing your comment.
Your personal data will only be disclosed or otherwise transmitted to third parties for the purposes of spam filtering or if this is necessary for technical maintenance of the website. Any other transfer to third parties will not take place unless this is justified on the basis of applicable data protection regulations or if pv magazine is legally obliged to do so.
You may revoke this consent at any time with effect for the future, in which case your personal data will be deleted immediately. Otherwise, your data will be deleted if pv magazine has processed your request or the purpose of data storage is fulfilled.
Further information on data privacy can be found in our Data Protection Policy.